No higher resolution available.
Graphof_%.jpg (419 × 240 pixels, file size: 39 KB, MIME type: image/jpeg)
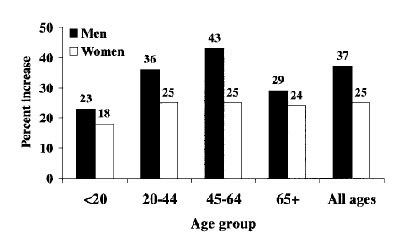
Graph representing the Percent increase between 1990 and 1997 in the prevalence of diagnosed diabetes by agegroup and sex among Native Americans and Alaska Natives.
File history
Click on a date/time to view the file as it appeared at that time.
| Date/Time | Thumbnail | Dimensions | User | Comment | |
|---|---|---|---|---|---|
| current | 19:48, 28 October 2008 | | 419 × 240 (39 KB) | Yuvizela (talk | contribs) | Graph representing the Percent increase between 1990 and 1997 in the prevalence of diagnosed diabetes by agegroup and sex among Native Americans and Alaska Natives. |
You cannot overwrite this file.
File usage
The following page uses this file: