J.M.Pearce (talk | contribs) |
Sophivorus (talk | contribs) m (Text replacement - "{{MOST lit}}" to "{{MOST literature review notice}}") |
||
| (39 intermediate revisions by 6 users not shown) | |||
| Line 1: | Line 1: | ||
{{MOST literature review notice}} | |||
== 1.0 Background == | |||
== Lunar In-Situ Resource Utilization (ISRU) == | |||
==Lunar In-Situ Resource Utilization (ISRU)== | |||
=== Google Scholar Search "ISRU" === | === Google Scholar Search "ISRU" === | ||
[1]G. B. Sanders and W. E. Larson, | [1]G. B. Sanders and W. E. Larson, "Progress Made in Lunar In Situ Resource Utilization under NASA's Exploration Technology and Development Program," J. Aerosp. Eng., vol. 26, no. 1, pp. 5–17, Jan. 2013, doi: 10.1061/(ASCE)AS.1943-5525.0000208. | ||
* 2004 US president initiates ISRU project | * 2004 US president initiates ISRU project | ||
* aimed at harnessing moon resoruces to allow for further expoloration beyond | * aimed at harnessing moon resoruces to allow for further expoloration beyond | ||
| Line 19: | Line 20: | ||
* Article goes into greater detail about projects and methods involved to achieve ISRU | * Article goes into greater detail about projects and methods involved to achieve ISRU | ||
[1]M. Anand et al., | [1]M. Anand et al., "A brief review of chemical and mineralogical resources on the Moon and likely initial in situ resource utilization (ISRU) applications," Planetary and Space Science, vol. 74, no. 1, pp. 42–48, Dec. 2012, doi: 10.1016/j.pss.2012.08.012. | ||
* Important to have O2, H2 and H2O | * Important to have O2, H2 and H2O | ||
* water present in shadowed craters | * water present in shadowed craters | ||
| Line 26: | Line 28: | ||
* Ilmenite reduction to produce oxygen or water | * Ilmenite reduction to produce oxygen or water | ||
== | == 2.0 Optical Spectrometry Overview == | ||
== How Spectrometry Works == | |||
=== Google Search for "Optical Spectrometry" === | |||
[1]"5.3 Spectroscopy in Astronomy - Astronomy | OpenStax." https://openstax.org/books/astronomy/pages/5-3-spectroscopy-in-astronomy (accessed Sep. 21, 2020). | |||
* Each element or compound has it's own spectral pattern | |||
* spectrometry can be used to identify material from far off distances. Used in Astronomy often. | |||
* continuous spectrum- is array of all wavelengths in visible spectrum | |||
* absorption spectrum - series of dark lines in a continuous spectrum | |||
* emission spectrum - series of bright lines in a continuous spectrum | |||
[1]"ESA - Eduspace EN - Home - Introduction," Jun. 11, 2010. http://www.esa.int/SPECIALS/Eduspace_EN/SEM7IQ3Z2OF_0.html (accessed Sep. 21, 2020). | |||
* white surface reflects equal amount of all colors | |||
* the amount of reflection a part of the spectrum determines color | |||
* may be a good idea to have rbg leds that can be lit seperately | |||
* atmosphere interferes with the measurement | |||
=== Google Scholar Search "photonic crystal spectrometer review" === | === Google Scholar Search "photonic crystal spectrometer review" === | ||
[1]N. K. Pervez, W. Cheng, Z. Jia, M. P. Cox, H. M. Edrees, and I. Kymissis, | The spectrometer that will be used is a photonic crystal spectral sensor spectrometer. This technology has been created within the last 10 years. | ||
[1]N. K. Pervez, W. Cheng, Z. Jia, M. P. Cox, H. M. Edrees, and I. Kymissis, "Photonic crystal spectrometer," Opt. Express, vol. 18, no. 8, p. 8277, Apr. 2010, doi: 10.1364/OE.18.008277. | |||
* spectrometer works by using a photonic crystal pattern and a camera | * spectrometer works by using a photonic crystal pattern and a camera | ||
* photonic crystal takes inputted light and outputs spectra | * photonic crystal takes inputted light and outputs spectra | ||
| Line 44: | Line 61: | ||
* photonic crystal can be made for specific applications to lower cost | * photonic crystal can be made for specific applications to lower cost | ||
[1]B. Momeni, E. S. Hosseini, M. Askari, M. Soltani, and A. Adibi, | [1]B. Momeni, E. S. Hosseini, M. Askari, M. Soltani, and A. Adibi, "Integrated photonic crystal spectrometers for sensing applications," Optics Communications, vol. 282, no. 15, pp. 3168–3171, Aug. 2009, doi: 10.1016/j.optcom.2009.04.052. | ||
* negative refraction and diffraction compensation used to create a compact chip | * negative refraction and diffraction compensation used to create a compact chip | ||
* high accuracy, can see spectral peak 10 pm accuracy in 50 nm bandwidth | * high accuracy, can see spectral peak 10 pm accuracy in 50 nm bandwidth | ||
* large SNR | * large SNR | ||
[1]Z. Wang et al., | [1]Z. Wang et al., "Single-shot on-chip spectral sensors based on photonic crystal slabs," Nat Commun, vol. 10, no. 1, p. 1020, Dec. 2019, doi: 10.1038/s41467-019-08994-5. | ||
* Microcavities increase optical path length. This overcomes problem of having long propagation path in small device | * Microcavities increase optical path length. This overcomes problem of having long propagation path in small device | ||
* Can have large-band filters using PC slabs | * Can have large-band filters using PC slabs | ||
| Line 55: | Line 74: | ||
* light absorption can be improved by using different materials, increasing spectral resolution | * light absorption can be improved by using different materials, increasing spectral resolution | ||
===See also=== | === Articles Found From Chromation Website === | ||
[1]K. M. Bryan, Z. Jia, N. K. Pervez, M. P. Cox, M. J. Gazes, and I. Kymissis, "Inexpensive photonic crystal spectrometer for colorimetric sensing applications," Opt. Express, OE, vol. 21, no. 4, pp. 4411–4423, Feb. 2013, doi: 10.1364/OE.21.004411. | |||
* size and expense can be dramatically reduced | |||
* math to determine spectral estimation inverse problem | |||
* estimation sensitive to noise | |||
* perfect and real data examples | |||
*# of photonic cyrstal channels and width of response functions determine res of spectrum | |||
[1]T. C. Garza, J. I. Scholtz, M. J. Gazes, I. Kymissis, and N. K. Pervez, "Low-cost photonic crystals for spectral sensors fabricated using projection lithography," in Next-Generation Spectroscopic Technologies VII, May 2014, vol. 9101, p. 91010F, doi: 10.1117/12.2053575. | |||
* Increased limits of projection lithography which makes manufacturing of spectrometer cheaper | |||
* e-beam lithography used to make 2D nanostructures | |||
* projection lithography is alternative to e-beam | |||
* method proved to be comparable and approved for use in manufacturing | |||
[1]N. K. Pervez et al., "Integrated Light Management as a Path to Miniaturizing Spectrometers," in Imaging and Applied Optics 2017 (3D, AIO, COSI, IS, MATH, pcAOP) (2017), paper ATh2A.3, Jun. 2017, p. ATh2A.3, doi: 10.1364/AIO.2017.ATh2A.3. | |||
* control of poynting vector allows for unique scattering geometry of light | |||
* chromation chip manages light to only allow certain range of light to reach photonic crystal | |||
* this enables small size | |||
=== See also === | |||
* [[Literature Review: Air Pollution Spectrometer]] | * [[Literature Review: Air Pollution Spectrometer]] | ||
=3.0 Lunar Resource Detection with Spectrometry= | == 3.0 Lunar Resource Detection with Spectrometry == | ||
==Resources Present in Lunar Soil== | |||
===Volatiles=== | == Resources Present in Lunar Soil == | ||
[1] | |||
=== Volatiles === | |||
[1]"SPACE TECHNOLOGY RESEARCH GRANTS PROGRAM, LUNAR SURFACE TECHNOLOGY RESEARCH OPPORTUNITIES APPENDIX." NATIONAL AERONAUTICS AND SPACE ADMINISTRATION (NASA), Jul. 15, 2020, Accessed: Jul. 28, 2020. [Online]. Available: https://nspires.nasaprs.com/external/solicitations/summary.do?solId={0BA38320-8F63-2EAF-D97B-0AB42AF17C35}. | |||
[[File:Table of lunar volatiles.png|1000px|Table of lunar volatiles from LCROSS data. Courtesy of the NASA 2020 LuSTER RFP]] | [[File:Table of lunar volatiles.png|1000px|Table of lunar volatiles from LCROSS data. Courtesy of the NASA 2020 LuSTER RFP]] | ||
===Non-Volatile Soil Composition=== | === Non-Volatile Soil Composition === | ||
=== Test Soil Composition === | |||
* MTU-LHS-1 used for testing | |||
*MTU-LHS-1 used for testing | ** Produced in-house at Michigan Technological University | ||
**Produced in-house at Michigan Technological University | ** Moderate fidelity regolith simulant for excavation and mobility testing | ||
**Moderate fidelity regolith simulant for excavation and mobility testing | |||
==Lunar Resource Detection Bands | == Lunar Resource Detection Bands == | ||
=== Tabulated target bands for resource detection === | |||
== 4.0 Chromation Spec Compact Spectrometer == | |||
This vendor-provided spectrometer will be used for future lunar resource detection in this research and development effort. | This vendor-provided spectrometer will be used for future lunar resource detection in this research and development effort. | ||
==Capabilities== | == Capabilities == | ||
*[https://www.chromation.com/ Vendor website] | |||
*[https://www.chromation.com/uploads/2/5/6/3/25635619/specdatasheetv03.pdf Spectrometer spec sheet] | * [https://www.chromation.com/ Vendor website] | ||
* [https://www.chromation.com/uploads/2/5/6/3/25635619/specdatasheetv03.pdf Spectrometer spec sheet] | |||
'''Optical properties:''' | '''Optical properties:''' | ||
*Spectral Resolution: 14nm FWHM | |||
*Spectral Range: 350-950nm | * Spectral Resolution: 14nm FWHM | ||
*Responsivity: 3*10^9 counts/J peak | * Spectral Range: 350-950nm | ||
*Measureable light level: 127nW-300uW | * Responsivity: 3*10^9 counts/J peak | ||
*Field of View: 45 deg. | * Measureable light level: 127nW-300uW | ||
* Field of View: 45 deg. | |||
'''Recommended operation parameters:''' | '''Recommended operation parameters:''' | ||
*Clock frequency: 5-8000 kHz | |||
*Sensor integration time: 0.0035ms | * Clock frequency: 5-8000 kHz | ||
*Supply voltage: 3-5.5V DC | * Sensor integration time: 0.0035ms | ||
* Supply voltage: 3-5.5V DC | |||
'''Absolute maximum operation parameters:''' | '''Absolute maximum operation parameters:''' | ||
* Supply voltage: -3 - 6 V DC | |||
* Operating temp range: -25 - 80C | |||
* Storage-free temp range: -25 - 80C | |||
* ESD resistance: +/-2000V | |||
* Max supply current: 4.5 mA | |||
=5.0 Other Spectrometers | == 5.0 Other Spectrometers == | ||
[1]T. L. Roush et al., | == 5.1 Space Mission Spectrometers == | ||
=== CRISM === | |||
[1]"CRISM Web Site," CRISM: Compact Reconnaissance Imager for Mars. http://crism.jhuapl.edu/index.php (accessed Sep. 22, 2020). | |||
==== Reflectance of Materials measured by CRISM ==== | |||
<gallery> | |||
Image:CRISM Data Plot 1.png| Fig 1: Sulfate Mineral Reflectance, courtesy of http://crism.jhuapl.edu/ | |||
Image:CRISM Plot 2.png| Fig 2: Phyllosillicate Reflectance, courtesy of http://crism.jhuapl.edu/ | |||
Image:CRISM Data Plot 3.png| Fig 3: Oxidized Iron Mineral Reflectance courtesy of http://crism.jhuapl.edu/ | |||
Image:CRISM Data Plot 4.png| Fig 4: Silicate Minerals Reflectance courtesy of http://crism.jhuapl.edu/ | |||
</gallery> | |||
==== CRISM specifications ==== | |||
* Scannable space-based spectrometer | |||
* used to determine mineral composition of mars and which places may of once had water | |||
* used for landing site selection | |||
* Bandwidth: 0.362-3.92 microns | |||
* 6.55 nanometers/channel | |||
* channels: | |||
** VIS/NIR: 106 channels, 0.3646-1.0560nm | |||
* visible strengths: | |||
** iron in minerals | |||
** rust/iron oxide (red) | |||
* IR strengths: | |||
** sulfates | |||
** carbonatees | |||
** hydroxyls | |||
** water | |||
==== Other CRISM Notes ==== | |||
* IR is needed to maximize ability to use spectrometry to find above volatiles when in minerals | |||
* Identifies composition of materials by looking at known absorption/reflectance bands for series of minerals/compounds | |||
=== NIRVSS - (Lunar Prospector) === | |||
[1]T. L. Roush et al., "In Situ Resource Utilization (ISRU) field expedition 2012: Near-Infrared Volatile Spectrometer System (NIRVSS) science measurements compared to site knowledge," Advances in Space Research, vol. 55, no. 10, pp. 2451–2456, May 2015, doi: 10.1016/j.asr.2014.08.033. | |||
[1]T. L. Roush et al., "NIRVSS Aboard CLPS," Mar. 2020, vol. 51, p. 2581, Accessed: Sep. 15, 2020. [Online]. Available: http://adsabs.harvard.edu/abs/2020LPI....51.2581R. | |||
[[File:Range of NIRVSS Detector .png|500px]] | [[File:Range of NIRVSS Detector .png|500px]] | ||
[1]"EMI / EMC Design for Class D Payloads(Resource Prospector / NIRVSS)," presented at the NASA Ames Instrumentation Workshop, Sep. 16, 2015, Accessed: Sep. 15, 2020. [Online]. Available: https://ntrs.nasa.gov/citations/20150020897. | |||
=== VINS - (Chang'e 3/Chang'e 4) === | |||
[1]C. L. Li, R. Xu, G. Lv, L. Y. Yuan, Z. P. He, and J. Y. Wang, "Detection and calibration characteristics of the visible and near-infrared imaging spectrometer in the Chang'e-4," Review of Scientific Instruments, vol. 90, no. 10, p. 103106, Oct. 2019, doi: 10.1063/1.5089737. | |||
[1]C. Li et al., "The Scientific Information Model of Chang'e-4 Visible and Near-IR Imaging Spectrometer (VNIS) and In-Flight Verification," Sensors, vol. 19, no. 12, Art. no. 12, Jan. 2019, doi: 10.3390/s19122806. | |||
* VNIS is based on an acousto-optic turntable filter (ATOF) spectrometry. Uses 2 ATOFs for VIS/NIR (V-NIR) and SWIR channels | |||
* Data collected is based on spectral reflectance from the solar radiation. | |||
[1]Z. He et al., "Visible and near-infrared imaging spectrometer (VNIS) for in-situ lunar surface measurements," in Sensors, Systems, and Next-Generation Satellites XIX, Oct. 2015, vol. 9639, p. 96391S, doi: 10.1117/12.2194526. | |||
* Spectral coverage (nm) | |||
** V-NIR:450-950 | |||
** SWIR: 900-2400 | |||
* Spectral resolution (nm) | |||
** V-NIR:2-7 | |||
** SWIR: 3-12 | |||
* FOV (degree) | |||
** V-NIR:8.5×8.5 | |||
** SWIR: Φ3.6 | |||
* Effective pixels | |||
** V-NIR: 256x256 | |||
** SWIR: 1 | |||
* Quantization (bits) | |||
** V-NIR: 10 | |||
** SWIR: 16 | |||
* SNR(dB) | |||
** V-NIR: ≥31 | |||
** SWIR: ≥32 | |||
* Spectral sampling interval (Nm) | |||
** Both: 5 | |||
* Power comsumption (W) | |||
** Both: 19.8 | |||
* Weight (kg) | |||
** 4.7 (Spectrometer Probe) | |||
** 0.7 (Logical Control component in RECB) | |||
== 5.2 Other Open-Source Spectrometers == | |||
[1]"SpectralWorkbench." https://spectralworkbench.org/ (accessed Sep. 22, 2020). | |||
* 400 to 700 nm range | |||
* $47 kit | |||
* legos, camera, and rasberry pi | |||
[1]S. Isaak, Y. Yusof, N. H. Ngajikin, N. Ramli, and C. M. Wen, "A low cost spectroscopy with Raspberry Pi for soil macronutrient monitoring," TELKOMNIKA, vol. 17, no. 4, p. 1867, Aug. 2019, doi: 10.12928/telkomnika.v17i4.12775. | |||
* looking for soil nutrients Nitrogen, Potassium, Phosphorus | |||
* looked at light power measurement with and without distilled water, spectral graph amplitude decreased | |||
[1]J. Pearce, Open-source lab: how to build your own hardware and reduce research costs. Amsterdam ; Boston: Elsevier, 2014. | |||
* MySpectral | |||
* Arduino Based | |||
* UV/Vis/IR | |||
* 400-760 nm | |||
* 10 nm res | |||
[1]K. Laganovska et al., "Portable low-cost open-source wireless spectrophotometer for fast and reliable measurements," HardwareX, vol. 7, p. e00108, Apr. 2020, doi: 10.1016/j.ohx.2020.e00108. | |||
* 450 nm to 750 nm | |||
* 15 nm res | |||
* use of white LED | |||
* need diff LED to cover full range | |||
* 3d printed box for Spect. | |||
* used files available | |||
* measured accuracy with RGB | |||
* look up dark noise | |||
* determine signal to noise ratio | |||
{{Page data}} | |||
[[Category:MSE5621-2020]] | |||
Latest revision as of 13:38, 14 April 2023
1.0 Background[edit | edit source]
Lunar In-Situ Resource Utilization (ISRU)[edit | edit source]
Google Scholar Search "ISRU"[edit | edit source]
[1]G. B. Sanders and W. E. Larson, "Progress Made in Lunar In Situ Resource Utilization under NASA's Exploration Technology and Development Program," J. Aerosp. Eng., vol. 26, no. 1, pp. 5–17, Jan. 2013, doi: 10.1061/(ASCE)AS.1943-5525.0000208.
- 2004 US president initiates ISRU project
- aimed at harnessing moon resoruces to allow for further expoloration beyond
- decrease cost by bringing less from earth
- find minerals and chemicals
- consumables such as propellants and life support
- structures
- energy
- equipement parts
- ISRU can improve resuability, duration of stay, protection of crew, exploration location, mission staging, abort strategies.
- Article goes into greater detail about projects and methods involved to achieve ISRU
[1]M. Anand et al., "A brief review of chemical and mineralogical resources on the Moon and likely initial in situ resource utilization (ISRU) applications," Planetary and Space Science, vol. 74, no. 1, pp. 42–48, Dec. 2012, doi: 10.1016/j.pss.2012.08.012.
- Important to have O2, H2 and H2O
- water present in shadowed craters
- "have revealed the presence of hydroxyl (OH), water (H2O), or both, in the lunar regolith in regions that are not permanently shadowed, through identification of absorption features near 3 mm wavelength. "
- solar wind implanted volatiles
- Ilmenite reduction to produce oxygen or water
2.0 Optical Spectrometry Overview[edit | edit source]
How Spectrometry Works[edit | edit source]
Google Search for "Optical Spectrometry"[edit | edit source]
[1]"5.3 Spectroscopy in Astronomy - Astronomy | OpenStax." https://openstax.org/books/astronomy/pages/5-3-spectroscopy-in-astronomy (accessed Sep. 21, 2020).
- Each element or compound has it's own spectral pattern
- spectrometry can be used to identify material from far off distances. Used in Astronomy often.
- continuous spectrum- is array of all wavelengths in visible spectrum
- absorption spectrum - series of dark lines in a continuous spectrum
- emission spectrum - series of bright lines in a continuous spectrum
[1]"ESA - Eduspace EN - Home - Introduction," Jun. 11, 2010. http://www.esa.int/SPECIALS/Eduspace_EN/SEM7IQ3Z2OF_0.html (accessed Sep. 21, 2020).
- white surface reflects equal amount of all colors
- the amount of reflection a part of the spectrum determines color
- may be a good idea to have rbg leds that can be lit seperately
- atmosphere interferes with the measurement
Google Scholar Search "photonic crystal spectrometer review"[edit | edit source]
The spectrometer that will be used is a photonic crystal spectral sensor spectrometer. This technology has been created within the last 10 years.
[1]N. K. Pervez, W. Cheng, Z. Jia, M. P. Cox, H. M. Edrees, and I. Kymissis, "Photonic crystal spectrometer," Opt. Express, vol. 18, no. 8, p. 8277, Apr. 2010, doi: 10.1364/OE.18.008277.
- spectrometer works by using a photonic crystal pattern and a camera
- photonic crystal takes inputted light and outputs spectra
- simple and cheap
- another version of this device has smaller range, but higher resolution
- photonic crystal can be made for specific applications to lower cost
[1]B. Momeni, E. S. Hosseini, M. Askari, M. Soltani, and A. Adibi, "Integrated photonic crystal spectrometers for sensing applications," Optics Communications, vol. 282, no. 15, pp. 3168–3171, Aug. 2009, doi: 10.1016/j.optcom.2009.04.052.
- negative refraction and diffraction compensation used to create a compact chip
- high accuracy, can see spectral peak 10 pm accuracy in 50 nm bandwidth
- large SNR
[1]Z. Wang et al., "Single-shot on-chip spectral sensors based on photonic crystal slabs," Nat Commun, vol. 10, no. 1, p. 1020, Dec. 2019, doi: 10.1038/s41467-019-08994-5.
- Microcavities increase optical path length. This overcomes problem of having long propagation path in small device
- Can have large-band filters using PC slabs
- able to obtain wavelengths from 550 to 750 with 1nm resolution
- light absorption can be improved by using different materials, increasing spectral resolution
Articles Found From Chromation Website[edit | edit source]
[1]K. M. Bryan, Z. Jia, N. K. Pervez, M. P. Cox, M. J. Gazes, and I. Kymissis, "Inexpensive photonic crystal spectrometer for colorimetric sensing applications," Opt. Express, OE, vol. 21, no. 4, pp. 4411–4423, Feb. 2013, doi: 10.1364/OE.21.004411.
- size and expense can be dramatically reduced
- math to determine spectral estimation inverse problem
- estimation sensitive to noise
- perfect and real data examples
- of photonic cyrstal channels and width of response functions determine res of spectrum
[1]T. C. Garza, J. I. Scholtz, M. J. Gazes, I. Kymissis, and N. K. Pervez, "Low-cost photonic crystals for spectral sensors fabricated using projection lithography," in Next-Generation Spectroscopic Technologies VII, May 2014, vol. 9101, p. 91010F, doi: 10.1117/12.2053575.
- Increased limits of projection lithography which makes manufacturing of spectrometer cheaper
- e-beam lithography used to make 2D nanostructures
- projection lithography is alternative to e-beam
- method proved to be comparable and approved for use in manufacturing
[1]N. K. Pervez et al., "Integrated Light Management as a Path to Miniaturizing Spectrometers," in Imaging and Applied Optics 2017 (3D, AIO, COSI, IS, MATH, pcAOP) (2017), paper ATh2A.3, Jun. 2017, p. ATh2A.3, doi: 10.1364/AIO.2017.ATh2A.3.
- control of poynting vector allows for unique scattering geometry of light
- chromation chip manages light to only allow certain range of light to reach photonic crystal
- this enables small size
See also[edit | edit source]
3.0 Lunar Resource Detection with Spectrometry[edit | edit source]
Resources Present in Lunar Soil[edit | edit source]
Volatiles[edit | edit source]
[1]"SPACE TECHNOLOGY RESEARCH GRANTS PROGRAM, LUNAR SURFACE TECHNOLOGY RESEARCH OPPORTUNITIES APPENDIX." NATIONAL AERONAUTICS AND SPACE ADMINISTRATION (NASA), Jul. 15, 2020, Accessed: Jul. 28, 2020. [Online]. Available: https://nspires.nasaprs.com/external/solicitations/summary.do?solId={0BA38320-8F63-2EAF-D97B-0AB42AF17C35}.

Non-Volatile Soil Composition[edit | edit source]
Test Soil Composition[edit | edit source]
- MTU-LHS-1 used for testing
- Produced in-house at Michigan Technological University
- Moderate fidelity regolith simulant for excavation and mobility testing
Lunar Resource Detection Bands[edit | edit source]
Tabulated target bands for resource detection[edit | edit source]
4.0 Chromation Spec Compact Spectrometer[edit | edit source]
This vendor-provided spectrometer will be used for future lunar resource detection in this research and development effort.
Capabilities[edit | edit source]
Optical properties:
- Spectral Resolution: 14nm FWHM
- Spectral Range: 350-950nm
- Responsivity: 3*10^9 counts/J peak
- Measureable light level: 127nW-300uW
- Field of View: 45 deg.
Recommended operation parameters:
- Clock frequency: 5-8000 kHz
- Sensor integration time: 0.0035ms
- Supply voltage: 3-5.5V DC
Absolute maximum operation parameters:
- Supply voltage: -3 - 6 V DC
- Operating temp range: -25 - 80C
- Storage-free temp range: -25 - 80C
- ESD resistance: +/-2000V
- Max supply current: 4.5 mA
5.0 Other Spectrometers[edit | edit source]
5.1 Space Mission Spectrometers[edit | edit source]
CRISM[edit | edit source]
[1]"CRISM Web Site," CRISM: Compact Reconnaissance Imager for Mars. http://crism.jhuapl.edu/index.php (accessed Sep. 22, 2020).
Reflectance of Materials measured by CRISM[edit | edit source]
-
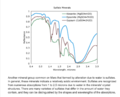
Fig 1: Sulfate Mineral Reflectance, courtesy of http://crism.jhuapl.edu/
-
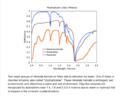
Fig 2: Phyllosillicate Reflectance, courtesy of http://crism.jhuapl.edu/
-
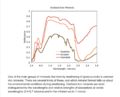
Fig 3: Oxidized Iron Mineral Reflectance courtesy of http://crism.jhuapl.edu/
-
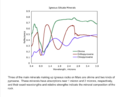
Fig 4: Silicate Minerals Reflectance courtesy of http://crism.jhuapl.edu/


CRISM specifications[edit | edit source]
- Scannable space-based spectrometer
- used to determine mineral composition of mars and which places may of once had water
- used for landing site selection
- Bandwidth: 0.362-3.92 microns
- 6.55 nanometers/channel
- channels:
- VIS/NIR: 106 channels, 0.3646-1.0560nm
- visible strengths:
- iron in minerals
- rust/iron oxide (red)
- IR strengths:
- sulfates
- carbonatees
- hydroxyls
- water
Other CRISM Notes[edit | edit source]
- IR is needed to maximize ability to use spectrometry to find above volatiles when in minerals
- Identifies composition of materials by looking at known absorption/reflectance bands for series of minerals/compounds
NIRVSS - (Lunar Prospector)[edit | edit source]
[1]T. L. Roush et al., "In Situ Resource Utilization (ISRU) field expedition 2012: Near-Infrared Volatile Spectrometer System (NIRVSS) science measurements compared to site knowledge," Advances in Space Research, vol. 55, no. 10, pp. 2451–2456, May 2015, doi: 10.1016/j.asr.2014.08.033.
[1]T. L. Roush et al., "NIRVSS Aboard CLPS," Mar. 2020, vol. 51, p. 2581, Accessed: Sep. 15, 2020. [Online]. Available: http://adsabs.harvard.edu/abs/2020LPI....51.2581R.

[1]"EMI / EMC Design for Class D Payloads(Resource Prospector / NIRVSS)," presented at the NASA Ames Instrumentation Workshop, Sep. 16, 2015, Accessed: Sep. 15, 2020. [Online]. Available: https://ntrs.nasa.gov/citations/20150020897.
VINS - (Chang'e 3/Chang'e 4)[edit | edit source]
[1]C. L. Li, R. Xu, G. Lv, L. Y. Yuan, Z. P. He, and J. Y. Wang, "Detection and calibration characteristics of the visible and near-infrared imaging spectrometer in the Chang'e-4," Review of Scientific Instruments, vol. 90, no. 10, p. 103106, Oct. 2019, doi: 10.1063/1.5089737.
[1]C. Li et al., "The Scientific Information Model of Chang'e-4 Visible and Near-IR Imaging Spectrometer (VNIS) and In-Flight Verification," Sensors, vol. 19, no. 12, Art. no. 12, Jan. 2019, doi: 10.3390/s19122806.
- VNIS is based on an acousto-optic turntable filter (ATOF) spectrometry. Uses 2 ATOFs for VIS/NIR (V-NIR) and SWIR channels
- Data collected is based on spectral reflectance from the solar radiation.
[1]Z. He et al., "Visible and near-infrared imaging spectrometer (VNIS) for in-situ lunar surface measurements," in Sensors, Systems, and Next-Generation Satellites XIX, Oct. 2015, vol. 9639, p. 96391S, doi: 10.1117/12.2194526.
- Spectral coverage (nm)
- V-NIR:450-950
- SWIR: 900-2400
- Spectral resolution (nm)
- V-NIR:2-7
- SWIR: 3-12
- FOV (degree)
- V-NIR:8.5×8.5
- SWIR: Φ3.6
- Effective pixels
- V-NIR: 256x256
- SWIR: 1
- Quantization (bits)
- V-NIR: 10
- SWIR: 16
- SNR(dB)
- V-NIR: ≥31
- SWIR: ≥32
- Spectral sampling interval (Nm)
- Both: 5
- Power comsumption (W)
- Both: 19.8
- Weight (kg)
- 4.7 (Spectrometer Probe)
- 0.7 (Logical Control component in RECB)
5.2 Other Open-Source Spectrometers[edit | edit source]
[1]"SpectralWorkbench." https://spectralworkbench.org/ (accessed Sep. 22, 2020).
- 400 to 700 nm range
- $47 kit
- legos, camera, and rasberry pi
[1]S. Isaak, Y. Yusof, N. H. Ngajikin, N. Ramli, and C. M. Wen, "A low cost spectroscopy with Raspberry Pi for soil macronutrient monitoring," TELKOMNIKA, vol. 17, no. 4, p. 1867, Aug. 2019, doi: 10.12928/telkomnika.v17i4.12775.
- looking for soil nutrients Nitrogen, Potassium, Phosphorus
- looked at light power measurement with and without distilled water, spectral graph amplitude decreased
[1]J. Pearce, Open-source lab: how to build your own hardware and reduce research costs. Amsterdam ; Boston: Elsevier, 2014.
- MySpectral
- Arduino Based
- UV/Vis/IR
- 400-760 nm
- 10 nm res
[1]K. Laganovska et al., "Portable low-cost open-source wireless spectrophotometer for fast and reliable measurements," HardwareX, vol. 7, p. e00108, Apr. 2020, doi: 10.1016/j.ohx.2020.e00108.
- 450 nm to 750 nm
- 15 nm res
- use of white LED
- need diff LED to cover full range
- 3d printed box for Spect.
- used files available
- measured accuracy with RGB
- look up dark noise
- determine signal to noise ratio