METHODS
The potential of successful PV mesh networks is based on five variables: system design and sizing, solar energy availability, economic analysis, and integrating geospatial information to optimize deployment locations. An example system was designed and built to assess the economic feasibility and overall system design. Utilizing PVSyst (refs) and ArcGIS (refs) technology, energy availability and demand was calculated for the system. Further analysis was done on the economic potential of the system compared to comparable technologies using previously published works (refs) and geographical referencing.
Locations of the study were chosen for their differences in solar energy availability and costs associated with Internet infrastructure implementation. Additionally, public or educational access to GIS data needed to be available. Therefore, the three locations chosen were in North America and compared townships in California, United States; Kentucky, United States; and Ontario, Canada. Each area has unique demographics, solar and infrastructure availability.
Design Methodology
The following design methodology was created, employed and demonstrated in an example system. The system includes three units to demonstrate the mesh network and its functionality with one unit connected directly to a broadband source and the other two functioning as relays. It was decided that the system use ultracapacitors where possible to demonstrate their potential in such an application and the feasibility of implementing such a system. The sizing of the electronic components was determined using PVSyst. The associated converters and controllers were selected to optimize efficiency while minimizing cost and necessary components. Mechanical components including the structural elements, mounting hardware, and fasteners were selected based upon the following criteria: cost, weight, strength, component life, transportability, ease of use, and maintenance. The structural support system was designed to hold the solar array at the optimum angle for the latitude at which the system will be utilized. Using the design methodology, several example systems were built for testing.
Include here exactly how this was done - e.g. screen shots explanations.
For the mechanical design show how this was done.
For the components - give a list and a weblinks to all parts.
Sizing of system parts
Equipment list inclues: PV panel, ultracapacitor bank, router, converters, batteries, hardware - this will be based on either PVSyst or GRASS/rsun in ArcGIS.
A micro-controller was chosen to control the converters and was selected to be XXX. Using PVSyst, it was determined that the system required a 13Ah capacity battery and a 190 Wp capacity solar panel. This would provide enough power and store sufficient energy for nights and low light situations. An ultracapacitor bank of 10 3000F is being used as the storage. The size of Ultra cap bank is 16.84 Ah and each Ultra capacitor is 2.25 Ah. Through simple calculations we find the total Ultra capacitors required is around 8 Taking an optimistic approximation of 10 Ultracapacitors will provide enough room for unprecedented events.
Going with an autonomy of 1 day and a maximum Loss of Load of 5% we can arrive at the size of the system as follows:
Ultra cap size = Total Wattage * number of hours *allowed autonomyDepth of Discharge*Efficiency*Operating voltage
The router chosen is a Cisco Linksys WRT54-- 6W. The Cisco router has specifications of: DOD=0.98, Efficiency=0.95, and an operating voltage of 9V.
The design of the mechanical components focused on simplicity and functionality. Material properties for each mechanical component were assessed to ensure all components could withstand the loading conditions including wind loads, rain loads, and snow loads (Messenger 2004). Each mechanical component was then sized using a factor of safety of 1.5. The frame is constructed from steel angle iron. A waterproof housing was employed to protect all necessary electronic components with size selected accordingly. This was done using a simple Rubber Maid container and waterproofing it with silicone glue on the seams. Wheels where incorporated into the frame for ease of transportation. A rack to hold the ultracapcitors in the waterproof housing was made using lightweight, inexpensive styrofoam.
What kind?
The results of sizing from PVSyst obtained are as 13Ah capacity battery, 92Wp capacity solar panel, Generalizing the design, a 10 ultracapacitor bank of 3000F each is being selected as the storage, and a 190Wp solar panel is used. Material properties for each mechanical component were assessed to ensure all components could withstand the loading conditions including wind loads, rain loads, and snow loads (PV Systems Engineering 2006). Each mechanical component was then sized using a factor of safety of 1.5.
Is this common?
How do you justify such a pad
Says who?
Say where this came from
Hardware Implementation:
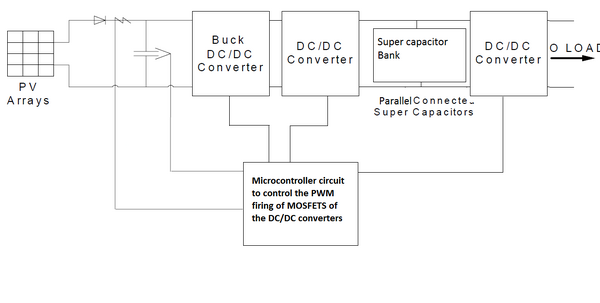
The implementation of the hardware is going to be made using DC/DC converters as shown in the schematic shown below
Describe what is going on below

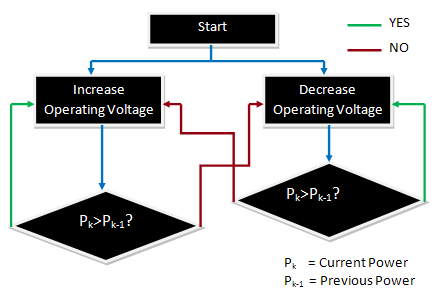
The firing of the MOSFET’s is done using a Micro controller based circuit, it has been proposed to use the Arduino Uno to implement this circuit. The Perturb and Observe algorithm being considered to be used to implement the MPPT control [1].The advantage of this method is , it is easy to implement and robust in structure which increases the efficiency of the system.

Economic viability
The present cost of bringing broadband Internet access to rural areas was compared to the implementation of PV mesh networks. A Comparison of router configuration was also done in order to optimize energy demand, with system configuration and antenna spacing. Finally, a comparison was made between the use of standalone PV systems and connecting areas to electric grid in distance from current availability. In order to perform the economic analysis the cost of stacking standalone systems to a rural area from a WLAN hub , a comparison to the cost of extending electric and broadband infrastructure was made. The total cost of the system was calculated to include solar panels, inverter, batter bank, router, mounting, installation, and travel to rural areas (McLaughlin et al. 2010). Additionally, connection costs and WLAN hub was also included but varies with distance from land lines.
Lots more details needed here -- think equations for the comparison.
Geographical potential using GIS
In order to assess various aspects of the PV system implementation, a geographical representation of the variables is necessary. Local level spatial disparities are necessary to assess to find places lacking infrastructure and technology for broadband access (Grubesic and Murray 2001).
Among the geo-processing capabilities of GIS perhaps the most useful is the overlay function. GIS has shown its usefulness in rural and urban planning, sustainable development, and identifying site specific locations (Refs). The different layers, including electric networks, broadband networks, and population density, can be synced to identify rural locations for technology dissemination. The geographical information system (GIS), ArcGIS, was used to organize spatial variables to find cells, of resolution 1 km2, that is appropriate for standalone PV system installation. We computed the locations of remote sites for SAPV installation from creating 6 layers incorporating buffers from the electric grid and broadband access at 500m, 1,000m, and >1,000m (Muselli et al. 1999). Additionally, a layer of population density is used to interpret potential market and impact.
Please add links to the data sets
If you can - can you use GRASS instead of ArcGIS
Testing methodology
The example system was tested using the following methodology. The system, comprised of three stand alone units, was placed outdoors with each branch unit roughly 500 meters from the main unit. The range and capacity of the mesh system was then measured. Finally, current and voltage readings for each unit were collected.
how?
Since the units were placed on rooftops, it was assumed that shading played a limited role and that systems were placed in an optimized location above shaded areas. Therefore, calculations regarding orientation and sizing due to shading parameters were ignored.
Start getting permissions for this now.

