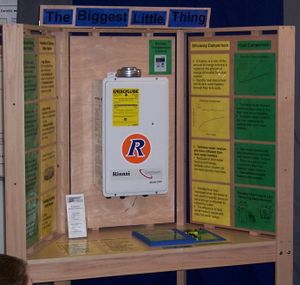
The Biggest Little Thing
A Tankless Water Heater Display for the Redwood Coast Energy Authority
Display by Team DWP: Amelia Dillon, Karen Wetherow, and Corin Pilkington
Objective
Our objective is to design an interactive display promoting energy conservation awareness for Humboldt County residents. This display shall be constructed to fit criteria set forth by the group, and with special attention paid to the recommendations of our client, the Redwood Coast Energy Authority, in Eureka, California.
Implementation Instructions

The Biggest Little Thing is designed to be easily implemented. The display can be placed in a showroom and used immediately. The interactive portion of the display is “The Biggest Little Difference” interactive bar graph. The Biggest Little Difference is not attached to the display in order for the user to hold it when operating it. The Biggest Little Difference asks questions to the user pertaining to hot water demands in their household. The questions are answered by sliding each bar until the corresponding number appears in a window. The difference in energy used by each type of water heater is then displayed as a bar graph. The bars representing tank water heaters are longer and have larger spaces between numbers to represent standby heat loss and low energy efficiency.
Repair Instructions
The parts of the display are commonly found at most hardware stores, making The Biggest Little Thing easy to maintain and repair. The display has very few moving parts that can break down and need attention. The information on the panels in The Biggest Little Thing can be easily removed and updated when necessary. The transparent paper that the information is printed on can be found and printed on at any stationary store. The interactive Biggest Little Difference will need biannual repainting and monthly cleaning.
Maintenance Instructions
- Check screws and bolts for tightness once a month.
- Clean panels and bar graph once a week.
- Check for scratches and missing parts of bar graph once a week.
- Update written information as necessary.