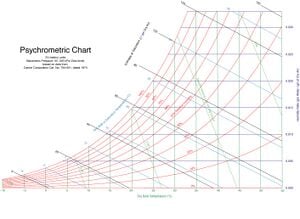
The Psychrometric Chart is a vital tool in evaluating any air conditioning system. Air contains water vapour as well as other gases and as as air is cooled or heated the relative humidity and moisture content of the air changes. The Psychrometric chart plots the relative humidity and the enthalpy of humid air against the temperature and the moisture content so that air conditioning processes can be modelled by drawing lines on the chart.
Temperature
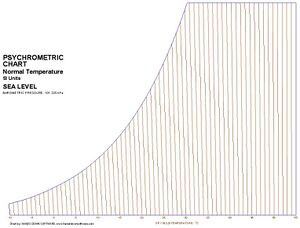
The horizontal axis for this chart is the air temperature in degrees Celcius and ranges from -10C to +55C.
Humidity
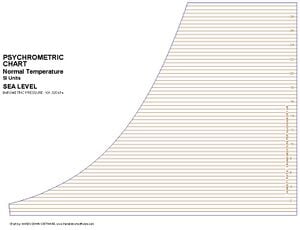
The moisture content of air is measured in grams of water vapour per gram of air (This article will use SI units throughout). This is the vertical axis of the chart and ranges from 0.000 to 0.030 and is labelled the Humidity Ratio.
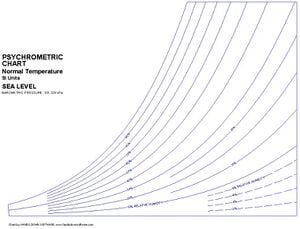
In general usage however Humidity is used to refer to the relative Humidity which is the air moisture content as a percentage of the maximum moisture content for air at that temperature. This maximum moisture content is the red line labelled 100% on the chart. No data appears on the chart past this line because air at normal sea level pressures cannot have a moisture content higher greater than this line. The other red lines labelled 90%, 80% etc. give the relative humidity values corresponding to any air temperature and moisture content.
Given the air temperature and the air moisture content of air you can plot this as a point on this chart. For example Air at 20C with an rH of 70% (point 1 on the tutorial chart) will have a moisture content of 0.010 grams of water per gram of air.
Heating
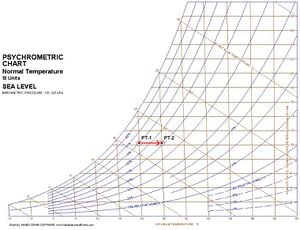
If you heat some air then the temeperature will increase and the point on the chart will move to the right. If we heat our 20C, rH70% air to 25C then the rH will drop to 50% (point 2 on the tutorial chart), provided the heating process does not add or remove moisture from the air.
Cooling
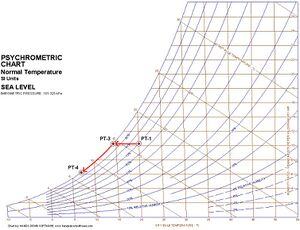
If we cool this air then we can see from the chart that when the air reaches 14C the relative humidity will be 100% (point 3). This is the dew point of air at 0.010 moisture content. When the air reaches this temperature we get condensation as the moisture starts to condense out of the air. If we cool any further then the moisture content will start to drop and the point on the chart will track the 100% line. This is dehumidification.
Evaporative cooling
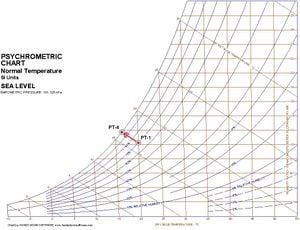
If we take our 20C, rH70% air and we spray 20C water droplets into it then these will evaporate, increasing the moisture content of the air. Converting water at 20C into vapour at 20C will however require the air to supply the evaporation energy to the water. Supplying this will cool the air so that we end up with air which is cooler but has a higher moisture content. This is known as Adiabatic cooling.
From the chart: air at 20C, rh70% (point 1) is between the 40 and the 60 J/g_dry_air but closer to the 40 line - say 45 J/g_dry_air. From the chart we can estimate that the 45 J/g line would intersect the rh100% line at about 17C air temperature (point 4) so we know that the coldest that evaporative cooling can cool this air is 17C.
Wet bulb temperature
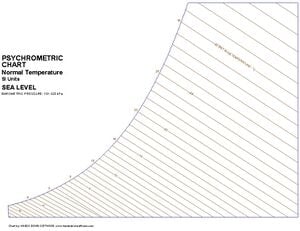
To measure the moisture content of air we use a wet bulb thermometer or a sling thermometer.
This is a thermometer where the temperature sensing elenment is wrapped in a wet cloth. As the air circulates past this the water evaporates and the water temperature drops until the water temperature is at the dew point for that air. This temperature can then be read from the thermometer.
Air at 20C, rh70% (point 1) will have a wet bulb temperature of 14C (point 3).
A sling thermometer is a thermometer which is mounted on a handle so it can be swung round in the air. This rapid air movement over the wet bulb means this will reach the wet bulb temperature more quickly.