Sources of waste: where to collect?[edit | edit source]
Depending on the geographical dispersion, degree of contamination and heterogeneity, it is possible to distinguish four types of plastic waste: industrial waste, commercial waste, agricultural waste and municipal waste.
Industrial waste[edit | edit source]
"Identified, unmixed, not polluted" We call "industrial waste" the waste produced by plastics processing companies, but also the leftover waste generated from the use of these plastics in the packaging industry, construction, ... These wastes have not yet been integrated into the consumption cycle. The plastics processing companies generate internal plastic waste which may be:
- Purges, which are usually in the form of large blocks of several kilos. These residues result from the discharge of injection or extrusion apparatuses. This can occur for various reasons: stops, maintenances, changes of molds or dies, changing of the coloring for the plastics. These plastics are not always top quality. They can particularly contain a large proportion of lubricants.
- Injecting carrots and grapes: this is the material that fills the injection channels (see Chapter 5). They are recovered during the demolding of the injected parts. They weigh, at most, a few tens of grams.
- Parts with defects which can therefore not be sold.
The combination of these residues may represent 10% of the production.
The large processing companies usually have their own recycling channel (primary recycling). Those that can not afford this prefer outsourcing this activity by giving or selling it to workshops capabale of recycling them. They are generally interested in rebuying the then recycled plastics.
Note: Purged blocks are very difficult to break apart. They require cutting beforehand which few companies bother to do. It can therefore be interesting to get them at a low price and recycle them. The processing companies are not the only producers of industrial waste. Other companies use plastics too. Their activities can generate large quantities of waste. As an example, we can take the manufacturers of window frames. They buy extrusion PVC profiles from processing companies. They then cut to them to size in order to make the chassis. They thus generate clean and well identified waste that can be easily collected and recycled. The packaging and conditioning sectors are also a good sources of waste. Industrial wastes are an often forgotten source of plastics. It offers however many advantages:
- Deposits already identified;
- Regulated supply;
- Clean and unmixed waste;
- Collection integrated within the undertaking;
- Collection points geographically well defined;
Commercial waste[edit | edit source]
"Identified, mixed" Commercial waste is waste from workshops and shops. After an inventory of these institutions, it is possible to identify the types of plastic waste they generate. A collection system can then be introduced within these institutions.
There are two types of commercial waste:
| Waste;mixed/little fouled | Waste;mixed/fouled |
| department stores (packaging),enterprises (pipes, films, ...), plumbing (PVC pipes) ... | hotels (containers, ...), restaurants, bars (vials, bottles, ...), service stations, garages (drums), hairdressers (bottles), hospitals, pharmacies, ... |
| Advantages: regular supply, established collection points, easy sorting, light wash | Advantages: regular supply, established collection points, easy sorting |
Table 3.1: Commercial waste types
Agricultural waste[edit | edit source]
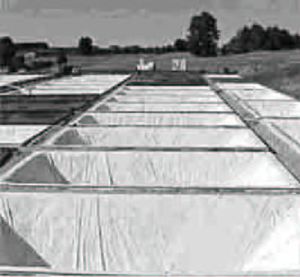
Farming and forestry activities also consume plastics for construction (irrigation pipes, stakes, tarps, ...) or for packaging (jerry cans, feed sacks, plastic film, ...). The deposits are often more distant, but this source should not be overlooked. With a good sensibilisation, farmers can store their plastic waste. We can then collect the waste once or twice a year.
Municipal waste[edit | edit source]
"Unidentified, mixed, fouled" Waste plastics from municipal waste is usually the most important deposit. The deposit is directly linked to the consumption of the target population, for two reasons:
- A resident can generate up to 1 kg of waste per day if his means is high, but this value is less for a person of limited means (less than 0.5 kg per day);
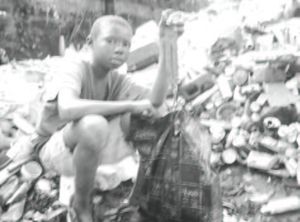
- also, depending on the living standard, the plastic content in the waste represents 3 to 8% (by weight). Also, the amount of plastic waste generated per person per year can vary between 5 kg and 25 kg. These wastes are usually heterogeneous, dispersed, and very heavily fouled. They consist primarily of packaging films, bags, bottles, ...
Their supply is however regular. We can recover plastics from municipal waste:
- directly from the consumer (least fouled)
- from streets and parks (very fouled)
- from sorting centers (very fouled)
- from dumps (very fouled)
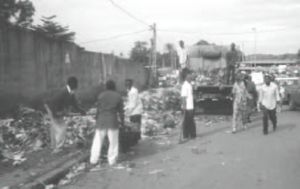
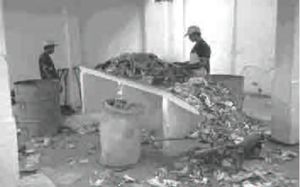
Sorting centers are usually micro-or small businesses that collect the household waste for conversion into compost. They often do a brief sorting of these wastes in order to extract the metals and plastics. If the metals are sometimes recovered, plastics are often placed together. They can represent significant deposits.
In addition to the regular supply, it is important not to overlook the waste generated by certain events such as local festivals, sidewalk sales, events, ... during which fouled waste plastics that are relatively well identified are discarded.
Evaluation of a deposit[edit | edit source]
The goal of a deposit evaluation is to determine the potential waste plastics that are available for a project: location, quantity, quality, renewal, ... The evaluation result is an indispensable step for the selection and design of a recycling system. It helps to know the amount of waste that can be treated, the types of plastics to recycle, the collection system to implement, the choice of machines, the necessary investment, the required amount of labor, ...
| Deposit evaluation campaign | Choices of approach |
|
|
Table 3.1: Specifics in evaluating a deposit for choosing an approach in recycling.
The following paragraphs describe the general approach for a detailed campaign relative to all possible sources of supply. When the outline of a project is already defined, it is not necessary to take into account all these steps. We leave the choice to the reader to refer to the third parties concerning his project.
Choosing a prospecting area[edit | edit source]
Above all, it is important to choose the geographical location in which plastics will be collected wisely. It is certain that one project is not another. Some constraints can directly define the collection area. Similarly, the objectives to attain for the project will be decisive. Also, for a plastic recycling project of which the objective consists to cooperating with a plan of waste managament in a neighborhood or village, we must ensure a large coverage of the generated waste in that zone. On the contrary, if the intention is to manufacture recycled plastic objects of quality, the project initiator will choose highly industrialized areas or areas with a high income where the quantity and quality of waste plastics are generally higher. However, some criteria must determine the selection of an area:
- We preferably select areas closest to the center of recycling. Indeed, transport of waste plastic is expensive. This is due to their low density: 100 to 400 kg/m³. The volumes to move thus become great quickly. At the transport level, the ideal location of the recycling center is obviously the center of the surveyed area.
- The amount of plastic waste generated by a household is related to its consumption, thus its purchasing power. We thus find more plastic waste in dumpsters of rich neighborhoods than in poor neighborhoods.
- The larger the area, the greater the collection system that needs to be set up. Initially, it is better to limit oneself to a small area, and then expand.
- Wherever possible, we try to integrate industrial areas. These indeed produce waste, but may also consume our recycled plastics.
Characteristics of the studied area[edit | edit source]
Once the prospection of the area is finished, a preliminary investigation is necessary to prepare the sampling campaign. This gathered information makes up a kind of identity card of the studied area. Amongst this information we find:
- The size of the area Szone(km²), preferably evaluated using a map;
- The number of inhabitants in the area Nzone;
- Population density Pzone, deduced from the first two numbers by the formula:
- The climate of the region. This affects the drying conditions: the number of days of sunshine, average temperature, rainfall, humidity, winds,... All these data are used for choosing one or
another drying technique.
- The main economic activities in the area: trade, agriculture, livestock, industries...
- A description of the habitat: rural or urban zones? The type of accommodation: detached house? buildings? farm?...
- Events and seasonal activities.
Events are special days during which the quantity of generated waste may be larger than usual: fairs, sidewalk sales, local events, festivals,... During a characterization campaign, we will not include these events. It is however important to identify them because they can require waste collections. Some regions enjoy seasonal activities. This is particularly the case in tourist areas where the influx of tourists during holiday periods increases the waste production (which may be significantly higher). It is then necessary to distinguish tourist periods from other periods.
Note: Where too are great differences within the study area occur, it is preferable to divide it into smaller areas (subareas). Each sub-area is characterized in the same manner as a zone. This can happen in the following situations:
- Two areas where living standards are significantly different;
- An industrial zone located next to a residential zone;
- A permanent market integrated into a residential area,...
Inventory of sources of waste plastics[edit | edit source]
Once the identity card of the zone is established, we can consider the possibilities to supply the waste plastics. This is done by making an inventory of the available sources. For each, we must collect a representative sample which, after characterization, evaluates the potential in recyclable plastics in the zone.
a. industrial waste The enumeration of plastic processing companies must be well beyond the borders of the targeted area. Indeed, they may play a determining role in the project: outsourcing of their internal waste, sale of used equipment, purchase of recycled plastics, ...
For each, we collect the following information:
- The type of plastic that they process: PP, PVC, HDPE, LDPE, ...
- The used processing techniques: injection, extrusion, blow molding, filming, ...
- Manufactured articles: catch basins, chairs, films, bags, shoes, ...
- Production (t/month).
We will also ask them the following questions:
- Does their activity generate waste?
- If so, what ? Purges, injection carrots or grapes, defective parts, ...
- Do they recycle their internal waste (primary recycling) ?
- Are they interested to outsource this activity (or a part thereof)?
- If so, which? How much plastic does that represent ?
We will also use this meetup to inquire about their interest on working with recycled materials from the treatment center established by the project (see chapter 6).
Besides the plastic processing companies, it is important to also identify all other companies with activities that generate waste plastics and fall into our line of work.
- What types of waste do they produce? How much? What do they make ?
- Would they agree to work with a recycling center? Under what conditions? Would they agree to establish a selective collection system for these wastes in their company?
b. commercial waste On a campaign evaluation, it is not possible to go around all of the businesses in the area in question. We rather evaluate this waste deposit using the following methodology:
- Determine the businesses that are most likely to generate waste plastics, and group them by category. For each category, describe the types of waste likely to be produced.
- Select a few traders and undertake with them a campaign of selective collection of their waste plastics. It doesn't do any good to work with too many businesses: three to five are usually sufficient. After having well explained the aim of the campaign to the traders, we suggest them to put aside all their plastic waste which they obtain in a certain period of time. A fortnight is recommended. After this period, we harvest the waste and store it in bags on which we note the name of the business and the waste class.
- Weigh all the bags and note down the weight category in a table. When a sample of a class seems different, it is better to discard it rather than wanting to integrate it at any cost. Indeed, it may distort the results, more than provide interesting information.
- For each category, estimate the number of businesses present in the area of prospection.
- Calculate the quantity of waste available by category and then sum them up to get the total weight of the of commercial waste in the area to study.
Notes:
- The sensibilisation of the traders in the project area is essential. The quality of samples collected is dependant on it. It is particularly important to emphasize that only the commercial waste must be preserved. They do not need to add any other waste. Some people have a tendency to insert all waste they find in order to show that they are able to raise significant quantities of waste. These laudable intentions may distort the data.
- Be wary of waste from hospitals and pharmacies. These may have contained drugs or other substances, and thus need to be handled with care. It is best to check with doctors and pharmacists, and to establish with them a list of "recyclable" waste. Other waste will be
not be collected.
- If the area is not too large, a systematic count of businesses may be achieved by walking the streets. When the area is too large, this work becomes too complex. We prefer to select only a few areas (preferably on the map), and counting the businesses in these neighborhoods and extrapolate the data for the entire area.
Example of a reminder table:
| Category | Type of waste | Sensibilised shops | In the zone | |||
| N° | kg | kg/com. | N° | kg | ||
| Garages | Oil cans | 3 | 6 | 0.5 | 22 | 44 |
| Service stations | Oil cans | 4 | 24 | 6 | 4 | 24 |
| Hairdressers | bottles (shampoo,lacquers, dyes, ...) | 3 | 0.3 | 0.1 | 27 | 2.7 |
| Cafes | bottles, racks, tables, chairs, ... | 5 | 2.5 | 0.5 | 46 | 23 |
| Pharmacies | bottles | 3 | 0.5 | 0.17 | 12 | 2 |
| Hospitals | bottles | 2 | 0.8 | 0.2 | 7 | 2.8 |
| Total | 98.5 |
Table 3.2: Example of a summary evaluation campaign (15 days)
Example: Estimated number of shops in an area of Kinshasa (2003) The study area comprises three communes of Kinshasa: Lemba, Ngaba and Makala. Living standards and activities of these three municipalities are very different, the area has been divided into three sub-areas corresponding to the three municipalities. Given the importance of sub-areas, only a few representative neighborhoods of the sub-areas were studied.
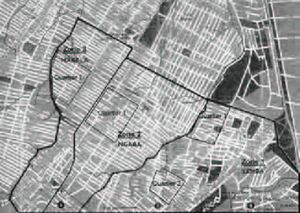
After having sensibilised some traders, a campaign of selective waste collection was undertaken over a period of 15 days. This has allowed to determine the amount of plastic waste produced by each category of businesses in each sub-area.
The results are extrapolated to the entire sub-area using an equal factor regarding the surface cover per subarea and those of the studied neighbourhoods.: Failed to parse (Conversion error. Server ("https://wikimedia.org/api/rest_") reported: "Cannot get mml. TeX parse error: Double subscripts: use braces to clarify"): {\displaystyle Q<sub>subarea</sub>=Q<sub>sensibilized</sub>_{X}_{N}<sub>neighbourhood</sub>_{X}_{S}<sub>subarea</sub>/S<sub>neighbourhood</sub>} with:
- Qsubarea (kg): quantity of plastic waste produced in the sub-area;
- Qsensibilized(kg/com.): quantity of waste plastics per sensibilised businesses;
- Nneighbourhood: number of enterprises in the studied neighbourhood(s);
- Ssubarea(m²): surface area of the sub-area (calculated from the map);
- Sneighbourhood(m²): surface area of studied neighbourhoods (calculated from the map).
All results are noted down into a table:
| Category | Sensibilised | In the neighbourhood | In the subarea | ||||||||
| (kg/com.) | N° | Kg | N° | Kg | |||||||
| Area 1 | Neighbourhoods 1 and 2 (12%) | ||||||||||
| Garages | 1.0 | 4 | 4.0 | 33 | 33.0 | ||||||
| Gas station-services | 4.0 | 6 | 24.0 | ||||||||
| Hairdressers | 0.1 | 4 | 0.4 | 33 | 3.3 | ||||||
| Cafes | 1.2 | 6 | 7.2 | 50 | 60.0 | ||||||
| Total of area 1 | 120.3 | ||||||||||
| Area 2 | Neighbourhood 1(13%) | ||||||||||
| Garages | 0.5 | 3 | 1.5 | 23 | 11.5 | ||||||
| Cafes | 1.0 | 7 | 7.0 | 54 | 54.0 | ||||||
| Pharmacies | 0.4 | 4 | 1.6 | 31 | 12.4 | ||||||
| Hospitals | 2.5 | 2 | 5.0 | 15 | 37.5 | Total area 2 | 115.4 | ||||
| Area 3 | Neighbourhood 3 (15%) | ||||||||||
| Hairdressers | 0.1 | 3 | 0.3 | 20 | 2.0 | ||||||
| Cafes | 0.7 | 6 | 4.2 | 40 | 28.4 | ||||||
| Pharmacies | 0.6 | 3 | 1.8 | 20 | 12.0 | ||||||
| Hospitals | 3.0 | 9 | 2.7 | ||||||||
| Total Zone 3 55.1 | |||||||||||
| Total in all zones | 280.8 |
Table 3.3: Evaluation of waste products in 3 commercial communes in Kinshasa
We take note that no service stations are installed in the two studied districts of Lemba (subarea 1). However, there are 6 in the municipality of where 2 were sensibilised (4kg/station). The results could of been directly placed in the last columns of the table. The same applies to hospitals in area 3. In total, the amount of commercial waste produced in the three municipalities has been estimated at 280.8 kilograms over a period of 15 days, or 561.6 kilograms per month.
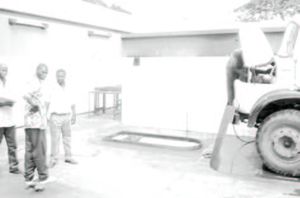
c. agricultural waste When such sources of waste presents themselves, we will apply the same evaluation methodology as for commercial waste. We however choose a longer period (2 to 3 months) and a number of larger enterprises.
d. municipal waste Before evaluating the municipal waste deposit in a targeted area, we first need to know what is currently happening with this waste by asking the following questions:
- Is there a collection system set up? If so, what type (see Selective collection systems)? Is it structured? What is the frequency of collection? What type of transport ?
- Where is the collected waste brought to ? Are they sorted in a recovery center for composting or other? Are they dumped in a municipal landfill or is it illegally dumped ?
- Is there a lot of garbage on the highway ?
After finding answers to these questions, it may be useful to sketch the transfer of the waste stream on paper to design a strategy for estimating the amount of available plastic waste. There is no universal strategy, every situation is different. However, some guidelines can be followed:
- To the extent that their activity is structured, it is always preferable to work with people already active in collecting garbage. In fact, they perform a collection directly from the consumer (upstream collection) with whom they generally maintain a relationship of confidence. After explaining the project in detail, it is possible to conduct a campaign evaluation with some of these collectors. This campaign will run for a fortnight and will consist of asking them to separate the plastic waste from the garbage they collect. After the campaign, the plastics will be weighed and the data will be entered in a table similar to that of the commercial waste. Extrapolating this to the entire area is done using an estimation of the areas covered by the collectors.
- Where there is no sufficiently structured collection system, it is possible to realise a sensibilisation campaign among the locals. To do this, simply select a few neighborhoods in the area and proceed in the same way as for commercial waste, motivating people to separate plastics and other wastes.
- The evaluation of waste lying in the streets is very difficult or impossible their waste flows are so irregular and heterogeneous.
- Direct evaluation in the landfill is always inadvisable because the waste released there are often very fouled and the hygienic condition for working here is precarious. However, when there is no alternative, this evaluation is relatively simple. It consists of determining the percentage of plastics contained in the garbage and assessing the amount of waste that is sent daily to the landfill. The product of these two results gives the amount of plastics available
every day: Failed to parse (Conversion error. Server ("https://wikimedia.org/api/rest_") reported: "Cannot get mml. TeX parse error: Double subscripts: use braces to clarify"): {\displaystyle Q<sub>discharge</sub>=\%<sub>plast.</sub>_{X}_{M}<sub>discharge</sub>}
with
- Qdischarge (kg/day): quantity of daily available plastic waste
- %plast.: percentage by weight of the plastics contained in the garbage
- Mdischarge (kg/day): daily quantity of garbage sent to through the discharge
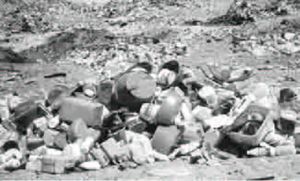
Sampling will be performed to characterize the identified plastic.
Characteristics of collected waste[edit | edit source]
Once samples are collected and gathered, we must determine what their main characteristics are to determine the proportion of recoverable material in these wastes. This characterization is done for each category of collected waste.
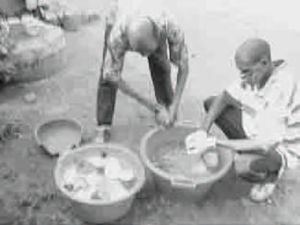
To do so, various data can be found on collected batches, namely:
- The degree of fouling: this is the proportion of matter other than the recyclable plastic that the waste contains: labels, metal components, plastics of a different nature than the object, ... It is found by removing these unwanted bodies, weighing them and calculating their proportion by weight (see chapter 2).
- The degree of soil: this is determined by weighing the samples before and after the washing (see chapter 2). Knowledge on the levels of fouling and soil of a batch of plastic allows the calculating of the amount of potentially recoverable plastics. For plastic bottles for which the degree of fouling is equal to 5% and the degree of soil is 10%, we know that for a kilo collected only 855 g. can potentially be recovered (0.95 x 0.90 x 1000g.)
- The types of plastics: these are determined by the recognition criteria described in chapter 2. Thus, for each collected sample, we determine the percentage of each major category of plastics (PP, HDPE, LDPE, PS, PVC) and the proportion of other plastics for which recovery will probably not be considered.
Besides these three types of important data, other characteristics may be determined. This is the case with the percentage of matter which can not go through a grinder and therefore requires a preliminary cut up. In the case where there is already a grinder, it is obtained by weighing the parts that are larger than the mouth of the grinder and dividing the obtained weight by the total weight of the sample. Otherwise, we will consider the waste that can not go through a rectangular hole (cut from a sheet of cardboard, for example) of 150 x 150 mm, corresponding to a typical opening of a grinder with a capacity of 150 kg/h as ungrindable.
Failed to parse (Conversion error. Server ("https://wikimedia.org/api/rest_") reported: "Cannot get mml. TeX parse error: Double subscripts: use braces to clarify"): {\displaystyle Plast.<sub>tobecutup</sub>(\%)=Plast.<sub>ungrindable</sub>(kg)/Sample(kg)_{X}_{1}00}
Vials and bottles are generally regarded as belonging to this category. Indeed, their rounded shape makes sure they are not driven by the grinder knives. They therefore require a preliminary division. Another interesting fact is the drying time (in the sun, for example) of washed plastic matter. It allows to evaluate the drying area to be foreseen and, if it shows that solar drying is not possible, allows to explore other drying techniques (see chapter 4). All these characteristics need not be determined for the entire collected batch. Smaller samples, but as representative as possible, may do the trick. Finally, all results will be placed in an overall table that will highlight the intresting deposits of plastics, to dimension the approach of recycling to be put in place (machines, human resources, consumables, ...) and to budget the project (see chapter 6). This approach seems long and tedious. It is however necessary if one wants to adopt a work strategy to implement into his recycling project, notably regarding the balance of material flows and economic prospects. Furthermore, characterization is not only useful for the evaluation phase, but also duting the production to reevaluate the operation of a certain deposit!
For more information on evaluating waste deposits: For people who dispose of only a minimum in equipment and knowledge regarding computing, the ModecomTM software is a useful tool to facilitate the management of the collected data of the campaign, but also during the period of production. This program, developed by ADEME (Agence de l'Environnement et de la Maitrise de l'Energie, France) for the management of domestic waste can be adapated to the projects described in this manual. It can manage the basic data and derive key information. For more information, consult the website of the ADEME (www.ademe.fr) at the section "publications". We find here the conditions of sale (price: 30,49 €) and a downloadable order form to send to the following address: ADEME 2, square La Fayette BP 406 - 49004 Angers cedex 01 France Tel: 00 33 (0) 2 41 20 41 20 Fax: 00 33 (0) 2 41 20 41 97

