Intro
This is a blog about publicly-shareable learning and information from the OSSTIP project. The idea is to reflect on and share useful ideas about the tools evaluated in the Open Source GIS-T Public Transport Tools Review, and how well they support us in developing alternative paths forward for Melbourne's transport system.
If you'd like to comment at the end of entries :- that's fine, but please use Appropedia conventions of signing your posts using the --~~~~ formatting.
Entries
2013-07-18 :- Working with GTFS transport schedules, and promising start with OpenTripPlanner's capabilities
Last week was a good week working on the project with Beyond Zero Emissions (BZE). They are working in parallel still on their high-speed rail study, but also have a couple of people already working on their Melbourne case study of options for de-carbonising transport in the Melbourne Metro region.
Learning about GTFS, and relevant tools like TransitFeed
Thus far, my focus has been on setting up and evaluating Open Source tools that can effectively work with public transport networks and timetables (in GTFS form), and perform analysis thereof (OSSTIP/WP3) - and the data these tools need/use/produce (OSSTIP/WP1).
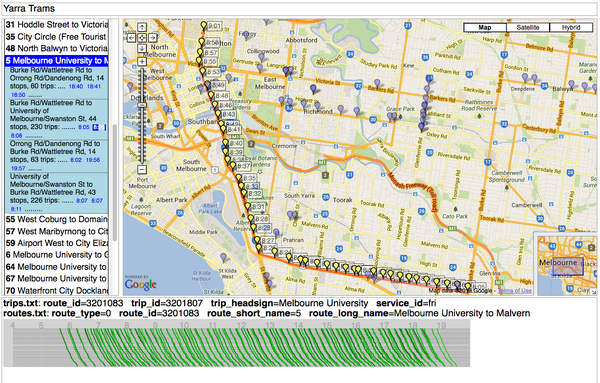
In this I had the much appreciated support of a friend who has developed Python scripts to transform the the database of Melbourne's public transit we had access to into GTFS format. His scripts used some open-source libraries and tools, TransitFeed. The latter include some nice validation and data exploration tools, like the ScheduleViewer web app (see screenshot below).

The data still needs some work, especially the bus network - but it was enough to start the next step. I would say that just by using the tool for a while, it helped get a better handle on the geography and layout of Melbourne's public transport system. This chimes in well with one of developer Andrew Byrd's stated goals for OpenTripPlanner Analyst, of being able to "better grasp the syntax of the urban environment and factors favoring spatial legibility for those of us navigating it via shared, scheduled and non-motorized transport."
This included for me realising just how complex Melbourne's current bus network is :- as one example, I noticed several route numbers are duplicated between areas of Melbourne and Victoria's regional towns. So improving the bus network does seem a worthwhile area to focus effort moving forward. I realise given Melbourne's history of privately-owned buses, the institutional aspects of this will be tricky, as my GAMUT colleagues like to point out ;) However, at least with this project we should be able to propose some useful ideas for the network itself.
First tests of OpenTripPlanner
The next step was exploring which OS tools best supported analysis operations on the data such as routing and calculation of isochrones etc, as per project WP2 :- Open Source GIS-T Public Transport Tools Review.
In this respect, OpenTripPlanner has offered the best mix of performance/usability so far. I did check out GraphServer, which might require less dependencies - but does seem more of a research, "DIY-tool", without too much user docs or 'hand-holding' to get you up and running. In contrast, OpenTripPlanner, while not having a perfect manual, has put in quite a lot of effort it seems e.g. by having an entire distribution you can download and install in one step, and also they provide "2-minute intro" and "5-minute detailed dive in" tutes on the project Wiki (see either of those pages for links to the download). For an Open Source project, I like this approach, as it helps people get over the initial barrier of using the software.
Note :- you are going to want to have a good internet connection though for this - the binary distribution is ~60megs, and the sample OpenStreetMap and graph files are 100mb+.
By mid last week I was able to get it to calculate and visualise travel time maps based on Melbourne's current PT network – e.g. screenshot attached of trip isochrones to Monash Uni Clayton.
My next step will be to investigate the ability of OpenTripPlanner, or possibly the OSAT plug-in developed on top of it by a US researcher (https://github.com/Noblis/OSAT), to do TAZ-based trip distribution calculations using OpenTripPlanner. While OTP is Java-based and is oriented towards presenting results on the Web using a REST design, it can be scripted to run in batch mode for these types of calculations. We are keen to test performance and see how it stacks up against the other tool the BZE guys are using for this.
Data Conversions and Github
Notably, a lot of the 'Open Source' work so far has involved scripts to transform data from one format to another – which gels with what full-time GIS project people tell me as a major time-absorber.
I was pleasantly surprised though that another BZE volunteer working on some of these already added them to a version controlled Github repository without my intervention – so BZE's first open source project was actually endogenous ;)
2013-08-29 :- Making some progress with OTP Batch Analyst for calculating OD Matrices and more advanced visualisations
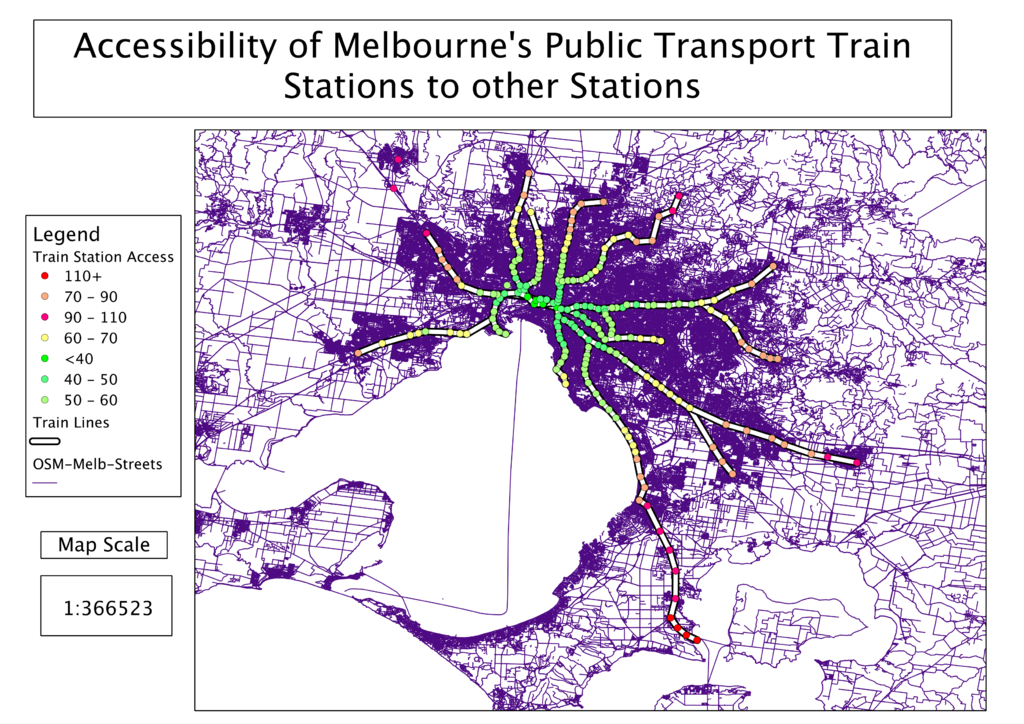
Map of Melbourne's Train Station Accessibility from Other Train Stations
Probably the best test so far on OSSTIP/WPBZE2 to test OpenTripPlanner's batch routing capabilities is this example of displaying Melbourne's train station accessibility from other train stations. The values vary from between just over 40 minutes, to a bit over 2 hours.
(It's a very simple metric thus far, as it takes no account of the 'value' of the other destinations, either for their 'centrality', or job/population catchment).
I used QGIS to create the visualisation :- it's really quite a capable tool once you get over the learning curve.

My Email about OTP's default maxTransfers value
See:- https://groups.google.com/d/msg/opentripplanner-users/m8xSRFOA8nY/e-UnlH2tQ4EJ
Hi there,
I've been using OpenTripPlanner as part of a research project to propose improvements to Melbourne, Australia's public transport network - and its shaping up really well so far.
A concern that arose today though from a transport planning perspective :- it appears the default value of maxTransfers=2 in the RoutingRequest class ?? I discovered this when doing some batch analyst tests and it was giving a -1 trip time value for several trips until I increased this parameter.
As a public transport-oriented researcher and advocate for sustainable transport I'm just a bit concerned with having a max transfer this low by default.
The reason is that a strong theme of research into transport best-practice in recent years is that for transit to compete with the car in terms of coverage, we need to plan entire networks that _do_ sometimes require several transfers to access all of a large urban region - but the transfer times should be minimised using pulse timetables or high-frequency services. See e.g. http://www.newsouthbooks.com.au/books/transport-for-suburbia_beyond-the-automobile-age/ or http://www.humantransit.org/2009/04/why-transferring-is-good-for-you-and-good-for-your-city.html
So could I suggest at least 3 as the default?? What do other users think?
I know its just a value that can be overridden in the application-context.xml :- but in my experience as a developer and scientist in computational modelling, default parameter values really do matter ;)


