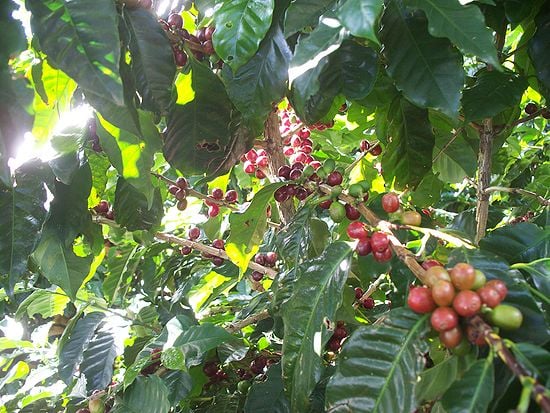
This article presents the life cycle analysis (LCA) of coffee (Figure 1). The total energy, carbon emissions, water use, and wastes are assessed over the life cycle of a cup (100 ml) of coffee. The summary and values below are limited to the most common form of coffee, that is produced through a drip filter.

Background
What is an LCA?
An LCA is an acronym for life cycle assessment. A life cycle assessment, or cradle to grave analysis, is a systematic method used for evaluating the life cycle of a product, or service. The evaluation generally includes but is not limited to: a list of all inputs and outputs, an energy analysis of all the upstream materials used, and the environmental impacts.
The Coffee Cycle
Growing and Treatment

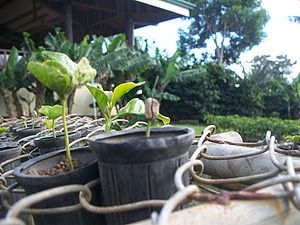
Before coffee can be consumed it must be grown and treated. A coffee plant starts from a bean. The bean from a coffee tree is planted in soil. Within 4 to 8 weeks a seedling appears(Figure 2). The seedling is placed in a shaded location so it will not burn in the direct sunlight. The seedling is tended and allowed to grow for the next 9 to 18 months, until it reaches approximately 2 feet. The small coffee tree is planted in the ground. The tree will bear fruit in 3 more years, but does not reach maturity until 6 years. At 6 years the tree is fully mature and produces it's optimal yield. The coffee tree will produce for 20 to 25 years.[1]
Roasting

Coffee is roasted to enhance the flavor of the raw or green coffee bean. When the green coffee bean is roasted chemical reactions take place that enhances the flavor and also destabilizes the coffee. The destabilized coffee will remain fresh for about a month. The green coffee bean is stable for much longer. Therefore roasting takes place just before selling to the end user.[2]
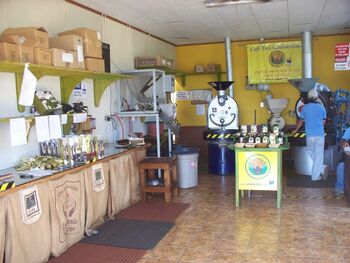
Coffee roasting starts with sorting the beans from the debris that is mixed in with the beans. After the coffee has been sorted it is weighed into batch size and placed within the roaster. The coffee is roasted anywhere from 3 to 30 minutes depending on the desired outcome (Figure 3). The temperature of the roaster ranges anywhere from 188 to 282 degrees Celsius. The length of time of roasting significantly impacts the flavor of the coffee. The less time the coffee is roasted the lighter the color of the bean at the end of roasting. The flavor of the lighter roast is characterized by the coffees original or raw flavor. The original flavor is reminiscent of the soil and climate the coffee was raised in. The longer the coffee is roasted the darker the color of the bean at the end of roasting. The darker roast coffee is shinier than the light roast because the heat extracts the oils from the inside of the bean. The flavor of the darker roast is characterized by the "roast" flavor. The roast flavor is so dominant that little of the original flavor is able to be tasted.
Transportation
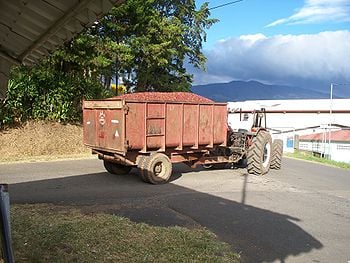
Coffee is grown all over the world and shipped to most of it. A large portion of coffee production costs and emissions come from its transportation. At the plant, coffee is trucked from the field and between processes. Leaving the plant, coffee is shipped mostly with boats and trucks. Figure 4 shows coffee berries being moved to the processing plant where they will be de-husked and dried. [3]

Brewing
In order to make a cup of coffee, the coffee beans must first be ground down to the proper consistency and then boiling hot water is run over them. The process is known as brewing. Brewing of coffee is done to extract the coffee flavor and caffeine from the roasted coffee beans. The coffee grounds should not be boiled with water because this process imparts a bad flavor to the cup of coffee.
There are three distinct methods of brewing coffee: steeped, boiled, and pressurized.
Steeped coffee is conventionally done in a french press. A french press is a cylindrical device made of glass that contains a metal plunger filter that fits tightly in the glass cylinder. Hot water and coffee are placed within the french press and allowed to brew for 5-10 minutes. The plunger is then pressed down separating the coffee grounds from the coffee solution. The steeping process makes a stronger cup of coffee because the coffee grounds remain in contact with the hot water longer. The longer the hot water stays in contact with the grounds, more of the flavor and coffee oils are extracted from the coffee grounds.
Boiling coffee is the oldest known brewing technique. Boiling coffee was traditionally done by placing coffee grounds and water into a pot and boiling it. The coffee was not boiled for long as this would make the coffee taste bitter. The liquid was poured into a cup and consumed. The liquid would generally contain some coffee grounds, but the majority of the grounds would be at the bottom of the pot.
Pressurized coffee brewing generally has two sources of pressure: gravity pressure and pressurized water.
Gravity pressure brewing is more commonly known as drip coffee. Drip coffee is by far the most common method of brewing in the USA. A filter is filled with coffee grounds and hot water is slowly allowed to flow through the coffee grounds. Gravity causes the hot water to flow down through the coffee grounds. The liquid drips out of the filter and is collected in a container and consumed.
Pressurized water brewing is more commonly known as espresso ( example Nespresso D290). A mechanical device heats and pressurizes the water and forces the hot water through some coffee grounds. The coffee that is brewed using this method uses more coffee grounds per ounce of liquid coffee than any other method.
Coffee Grounds
After brewing a cup of coffee the coffee grounds remain and must be disposed of. The three common disposal methods are: solid waste, wastewater, and recycled.
Coffee grounds that are placed in the trash end up being shipped to some regional solid waste facility or dump.
Coffee grounds that are washed down the drain are transported via wastewater in the sewer lines to the wastewater treatment plant. At the wastewater treatment plant, the grounds are separated out and treated according to that particular treatment plant's protocols.
Coffee grounds that are recycled are usually composted or used to amend the soil for plants. Composting the coffee grounds enriches the nitrogen content of the compost. Because of the coffee grounds individual small size, it breaks down and composts relatively fast. When the coffee grounds are used as an amendment to the soil, the grounds slowly release nitrogen and add acid to the soil.
LCA Results: A Review of Total Resources Used
Three tables are presented to summarize the energy use (Table 1), water use (Table 2), and carbon emissions of coffee (Table 3). It should be noted that "processing" in the tables includes: green coffee handling & cleaning, roasting, grinding, filling & packing and conditioning.
Energy
Energy use for each process is presented in Table 1. The total energy used per one cup of coffee produced is 1.94 Mega Joules (roughly the kinetic energy of two school buses traveling at 50mph). About 60% of this energy is used near the end of the coffee's life where it is brewed and the cup is washed, brewing and washing in Table 1. This loss in efficiency stems from the small scale at which coffee is being brewed but also the relative efficiency of coffee brewers (large plants have ways of reclaiming energy whereas consumer products do not).
| Process | MJ per 100mL |
|---|---|
| Irrigation (4000 m^3/ha/yr) | 0.24 |
| Brewing | 0.86 |
| Washing | 0.39 |
| Cup and Coffee Equipment Manufacture | 0.05 |
| Distribution | 0.03 |
| Processing | 0.05 |
| Packaging | 0.04 |
| Delivery | 0.04 |
| Treatment | 0.11 |
| Cultivation | 0.2 |
| End of Life Wastes | -0.07 |
| Total | 1.94 |
Water
Water is used extensively in the growth, processing, and preparation of coffee. Table 2 reports the liters of water used per one cup of coffee produced. Processing and delivery are assumed to use no water when making drip filter coffee. Irrigation was by far the largest user of water in the coffee cycle, using 28 liters of water per one cup (100mL) of coffee. That is 280 times more water than the 100mL in the coffee cup.
| Process | Water use (liters/100mL) |
|---|---|
| Irrigation (4000 m^3/ha/yr) | 25 |
| Brewing | 1.96 |
| Washing | 1.22 |
| Cup and Coffee Equipment Manufacture | 0.07 |
| Distribution | 0.05 |
| Processing | - |
| Packaging | 0.1 |
| Delivery | - |
| Treatment | 0.13 |
| Cultivation | 0.37 |
| End of Life Wastes | -0.07 |
| Total | 28.83 |
Carbon Emissions
Carbon emissions were based on a European energy mixture for electricity usage, vehicle fuel, processing procedures etc.[3] Table 3 shows the emission of each part of the process with a total carbon emission of 114 grams carbon-dioxide equivalent per one cup coffee produced. The most notable numbers are brewing, washing, and cultivation; 44.03, 20.87, and 24.37 g of Carbon-Dioxide Equivalent per 100mL respectively. Carbon emissions for brewing and washing come from the power plants that provide the energy to heat water. Emissions for cultivation largely come from farming equipment, like diesel tractors.
| Process | g of Carbon-Dioxide Equivalent per 100mL |
|---|---|
| Irrigation (4000 m^3/ha/yr) | 6.08 |
| Brewing | 44.03 |
| Washing | 20.87 |
| Cup and Coffee Equipment Manufacture | 3.29 |
| Distribution | 2.79 |
| Processing | 2.63 |
| Packaging | 2.79 |
| Delivery | 2.63 |
| Treatment | 8.38 |
| Cultivation | 24.32 |
| End of Life Wastes | -3.78 |
| Total | 114.03 |
References
- ↑ Coffee Detective, Uncovering the facts about coffee and coffeemakers. Samariah Sampson (2007).
- ↑ Stuff. The secret Lives of Everyday Things. John C. Ryan, and Alan Thein Durning. Northwest Environment Watch (1997).
- ↑ 3.0 3.1 3.2 3.3 3.4 Life cycle assessment of spray dried soluble coffee and comparison with alternatives (drip filter and capsule espresso). Sebastien Humbert, Yves Loerincik, Vincent Rossi, Manuele Margni, Olivier Jolliet. Journal of Cleaner Production 17 (2009) 1351–1358.