Introduction
In 2010 HSU disposed roughly 900 tons of waste a year, some of which can be diverted from the landfill to meet Assembly Bill 341’s requirement of 75% diversion by year 2020. To meet that goal, the campus is aggressively looking for more ways to reduce, reuse, and recycle. This project is intended to create a possible solution for diverting additional waste from the landfill in order to meet this goal.
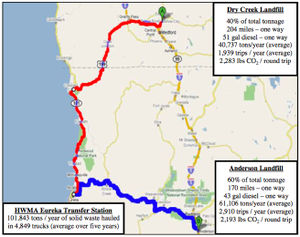
We have a unique situation as Humboldt County’s, Cummings Road Landfill located on Pine Hill in Eureka, CA was capped and closed at 1,825,212 tons of waste in 2000 [1]. Consequently, all waste generated is now trucked an average of 187 miles (380 miles round trip) out of county to the Dry Creek Landfill in White City, Oregon or to the Anderson Landfill outside of Redding, CA [2].

The cost of transportation in diesel fuel and the external costs in GHG’s are significant. Roughly 100,000 tons of waste is transported out of Humboldt County per year, generating 4,484 Metric Tons in GHG’s [3]. Landfills themselves are a source of Greenhouse Gas emissions, which include Carbon Dioxide (CO2), Methane (CH4), and Nitrous Oxide (N2O). Most of these GHG emissions are produced from organic material breaking down under anaerobic conditions, while other forms of solid waste do not produce GHG’s because they are not composed of carbon [4]. Paper towels are included as a type of “organic waste”, making them a viable target for reducing GHG at the landfill and in transportation. As an early adopter to the HWMA pilot study the Department of Sustainability along with Waste Reduction and Resource Awareness Program(WRRAP) will be collecting food waste from two main cafeterias to determine the mass and volume generated on campus. The data will help as HWMA is preparing to bring a municipal anaerobic digester online as early as January 2012.


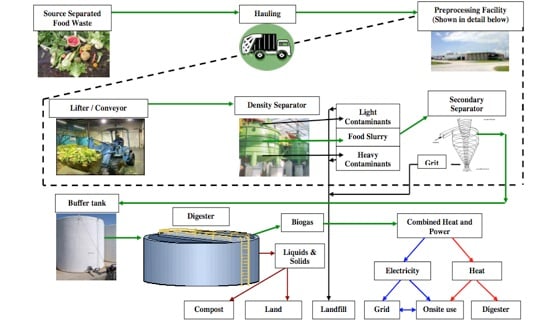
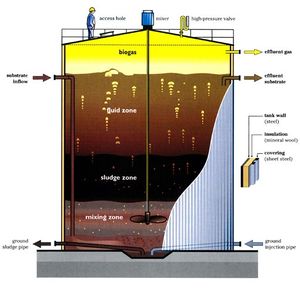
Anaerobic digestion is the decomposition of organic matter by microorganisms in an oxygen free (anaerobic) environment, creating biogas, residual solids and liquids [5] The biogas will be used to power the actual digesting plant, thereby reducing HWMA’s dependence on electricity and their Greenhouse Gas Emissions (GHG’s). The residual solids and liquids are nutrient-rich and valuable soil amendments, with the possibility of providing an additional source of revenue for the facility [6].
For more information see Anaerobic digestion wiki.
Current Paper Waste Diversion Programs
There are many institutions such as schools, companies, and municipalities that have incorporated a paper towel diversion program. The following institutions reduce their solid waste by 'composting' their paper towels:
- American University, Washington, D.C.
- Parliment Hill, Ottowa, Ontario, Canada
- University of Californaia, San Fransisco
- Royal Roads University, Victoria, British Colombia.
Many anaerobic digestion technologies are commercially available and have been demonstrated for use with agricultural wastes and for treating municipal and industrial wastewater. There are very few examples of institutions utilizing municipal 'anaerobic digesters':
- [University of California, Berkeley]
Project Goals
Our overarching strategic goal is to simply reduce the amount of waste being generated on campus and transported long distances to the landfill. This will in turn, reduce the GHG emissions associated with HSU and hopefully complement the future food waste-composting program being studied. Many stakeholders, including HSU, the campus Sustainability Department, WRAAP, and HWMA, share this goal.
In order to meet our strategic goal, we need to implement several programmatic goals or objectives. The following is a comprehensive list of what these goals are in chronological order:
- Develop and maintain relationships with all stakeholders.
- Research existing policy framework and determine if paper towels can be legally composted in the county.
- Research similar programs at other colleges.
- Research the type and brand of paper towels currently being used on campus and determine if they are an efficient feedstock for an anaerobic digester.
- Observe custodians during work and discuss issues and troubleshoot obstacles pertaining to collection methods.
- Perform a baseline study of current paper towel waste generation in a random sample of bathrooms on campus on campus to determine estimates of volume and weight.
- Perform a behavior change study to determine how well students are informed and can comply with a possible bathroom towel waste-composting program.
- Compile an organized planning document for future students to use to implement the actual paper towel waste composting program in the future
To gain support for our project we would like to prove that it could be successful by achieving a 70% decrease in contamination in our paper towel collection bins.
Implementation
This project is a three phase process, each phase lasting one semester. Our portion of the project was the begging Phase: Phase one.
- Research existing paper towel diversion programs
- U.C. Berkeley
- Santa Clara State University
- Schedule meetings to determine feasibility, legality, and logistics.
- Office of Sustainability.
- Humboldt Waste Management Authority.
- Humboldt County Environmental Health.
- Facilities Manager and Custodians.
- Begin Data Collection
- Sample gallery
-
Sample caption text.
-
More sample caption text. This would look better with different images. :)
-
Even more sample caption text.
Results
Baseline Data Collection
Baseline data consisted of a 4-day collection period and 132 bathrooms from 7 different buildings between the dates of 11/07/2011 and 11/10/2011. A total of 247.8 lbs of paper towels were collected. We measured 29.6 lbs of contamination mixed in with he paper towels, for a total waste mass of 277.4 pounds. Between the seven buildings we collected 24.7 full bags of paper towels at 2.7 cubic feet per bag; that’s 66.69 cubic feet of paper towels collect on the first week(See Appendix A5).
Behavior Change Data Collection
The behavior change data sampled a total of 129 bathrooms in 7 buildings between the 11/29 and 12/2. A total of 168.1 pounds of paper towels were collected. We measured 6.7 pounds of contamination mixed in with the paper towels. Our bins marked “everything else” contained 26.3 pounds of waste. In total, 201.1 pounds were removed from the sample bathrooms. A total of 16 full bags at 2.7 cubic feet per bag for a total of 43.2 cubic feet of paper towels. Observations of contamination and “everything else” bins were noted (See Appendix A6).
Analysis
Over an eight-day period a total of 478.5 pounds of waste was removed from the sample bathrooms. Our baseline data averaged 1.9 pounds of paper towels and 0.2 pounds of contamination per bathroom. This was smaller in our behavior change sampling at 1.3 pounds of paper towels and 0.05 pounds per bathroom. This data shows a 120% difference or a 75% decrease in contamination. Assuming 120 bathrooms on campus, we can extrapolate the average of 1.6 pounds of paper towel mass per bathroom for a total of 192 pounds generated in one day. This equates to 29,952 pounds or 15 tons of paper towels per semester. We calculate an average of 10 pounds per full bag. This represents a total of 2,995 full bags of paper towels. At conservative estimate of 2.7 cubic feet of compressed paper towels per bag this equates to a volume of 8,086.5 cubic feet. This volume of paper towels alone requires 2.7 waste hauling trucks. Using our data to calculate possible GHG offsets and reductions in disposal fees, we came up with a reduction of roughly 2,260 kg CO2/year and a savings of $2,250 a year. Current disposal costs of HSU are around $135,216 per year with a GHG equivalent of 37,725 kg CO2/year (See Appendix A6). These numbers are conservative because they do not account for the large amount of volume of uncompressed paper towels.
Discussion
Weakness in study
Time was a very limiting factor in our study. Before we could even begin to consider measuring volume and mass, we needed to gain approval from the Office of Sustainability, Humboldt County Environmental Health, the Facilities Manager, the custodial staff, and Dr. Richard Hansis. After having accomplished said approvals, we were left with just a few weeks to conduct the study. The study itself was also a very time consuming entity, with only two students committed to the research, data collection ranged between 2-4 hours a night. Additionally, the deadline for the report was the day after the final night of paper towel collection, leaving just a few hours of analysis before submission.
We believe that an adequate duration and sample size of data collection far supersedes that in which we provided. Perhaps an entire semester including weekends, special events such as football games, and holidays are required to supply a more accurate representation for HSU’s paper towel content. Also an increase in sample size is recommended for a more complete statistical analysis. We were only able to acquire 32 out of the assumed 120 bathrooms located on HSU. This would require a larger work force with a longer time allowance than we were able to attain.
The device we used to measure mass was a standard, inexpensive bathroom body weight scale with a high margin of error. With contamination levels averaging a pound per building, it was nearly impossible to obtain accurate readings with this simple scale. We recommend using a hanging spring scale with accuracy up to one hundredth of a pound.
Lastly, the social marketing portion of our project that we implemented was limited to signs posted in the bathrooms next to the waste bins. These signs were merely temporary, laminated, color coordinated pieces of paper held aloft by strips of 14-day painters tape. This left the study vulnerable to sign removal and vandalism, which we experienced at multiple collection sites. Future signage needs be on a more permanent basis and should be harder to remove by the casual passer-by.
In the November 30, 2011 issue of the campus newspaper “The Lumberjack”, the second day of our behavioral change pilot study (Poor, K. 2). This could have boosted participation from students and faculty on campus. Although this was rather serendipitous, it could be employed as a social marketing tool in the future.
What we learned
Of the many lessons garnered from this study, we found that establishing communications and building relationships with people and organizations are paramount. A good example of this would be that of the custodial staff; without their support and being allowed to conduct this study in their respective areas-of-responsibility, we would not have been able to pursue this experiment at all.
Accuracy and precision are important when measuring paper towels and especially contamination, given that large amounts of volume do not necessarily mean a high measurement of mass.
Effective signage is key to communicate your message. We used only temporary signs that we held to the wall by 14-day painters tape, however we experienced a 120% difference in behavior change. With a more permanent sign/education system even higher results can be expected.
A large amount of time, labor, and commitment is required for this study. Two students spent an average of 2.5 hours each collection night, for 8 nights (does not include sign posting and removal), additionally a week of preliminary observation was conducted by a student for an hour each night the week prior to data collection. That’s a total of 45 hours just on collecting paper towels.
We also learned that, with communicating with a wide variety of people and organizations, there would always be “naysayers”, which are those who don’t initially agree with the proposed project or its methodologies. But we also found that brainstorming with them can help provide new, out-of-the-box ideas that were not originally included in the study.
Successes
Our project had numerous successes. Our biggest success was conducting a rudimentary pilot study allowing us to evaluate some of the issues necessary to continue this project in the future.
Another success was the creation of interest and support from different collaborators forming a project network. We feel that these relationships are very important and should be maintained to ensure future participation.
We were also successful in reaching out to our friends and peers for help. Much of the data sampling would have been very difficult without the help of our volunteers for whom we are grateful to.
And of course we feel successful in conducting a study that met our objective of reducing contamination in the paper towel bins by 70%. This proves that there is hope that students can make a difference and support a paper towel waste diversion program.
Costs
You may describe your costs here.
| header 1 | header 2 | header 3 |
|---|---|---|
| row 1, cell 1 | row 1, cell 2 | row 1, cell 3 |
| row 2, cell 1 | row 2, cell 2 | row 2, cell 3 |
See Help:Tables and Help:Table examples for more.
Next Steps
The next steps.
Conclusions
Your conclusions.
References
Contact details
Add your contact information.
