No edit summary |
|||
| Line 55: | Line 55: | ||
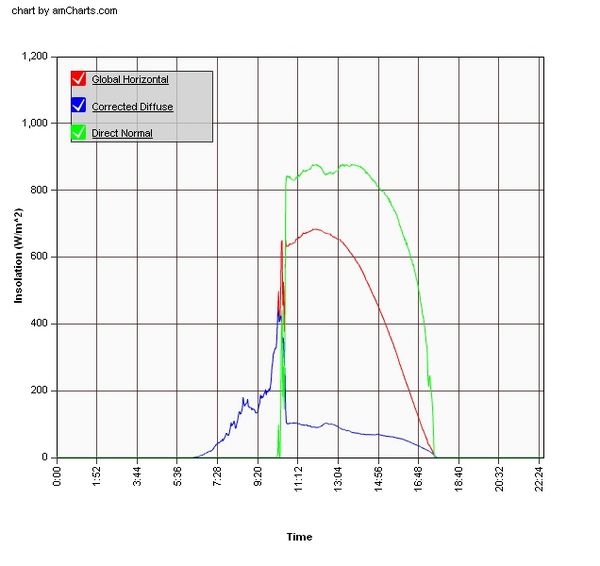
[[Image:Chart.JPG|center|thumb|600px|Fig.5 An example of the data SoRMS collects]] | [[Image:Chart.JPG|center|thumb|600px|Fig.5 An example of the data SoRMS collects]] | ||
===Making Use | ===Making Use Of SoRMS Data=== | ||
---- | ---- | ||
Revision as of 22:44, 11 December 2009
The Solar Radiation Monitoring Station
What Is SoRMS
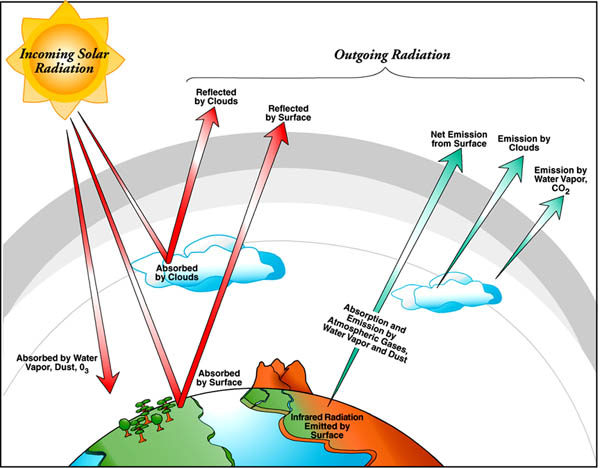
The Solar Radiation Monitoring Station (SoRMS) project is one of Humboldt’s Renewable Energy Students Union’s (RESU) responses to the need for more renewable energy. The basic idea behind this specific system is not to create power but to collect information on solar power. As dimenstrated in the photo to the right (Fig.1), the usable Solar Radiation is more complicated than simply what the sun puts out. The atmosphe in which the radiation travels through needs to be taken into acount due to it's distorting effects on usable energy at the surface.
Because of the localized weather in coastal zones, most solar research facilities do not deal with the thick cloud cover found there. The focus of the SoRMS project is to collect local solar radiation data and make that data available to the public. Although conducted in Arcata on the Northern Coast of California, the SoRMS project is producing data that will help to fill in the informational gap for other areas with similar atmospheric conditions. In this manner SoRMS is contributing to a more comprehensive idea of the energy that can be expected from solar systems. With measurements of local solar energy people will have a better idea about solar powers productivity in areas that deal with more clouds and fog. This information can be used to help determine solar array sizing, battery stroage requirements, and project payback.
How The Project Works
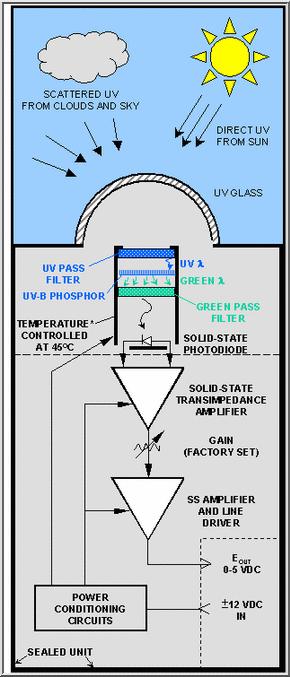
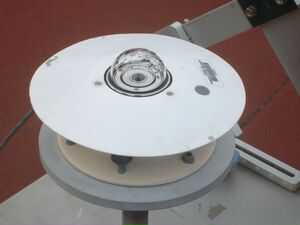
The amount of energy coming from the sun is measured with the use of an Eppley Precision Spectral Pyranometer (PSP) seen in the upper left photo(Fig.2). This measurement is done by comparing the heat absorbed through radiation of an absorptive black surface and a reflective surface. There are two of these PSP’s, one is in the open sunlight and one is covered by what is called a shadow band. The shadow band is seen bent around the PSP on the right of the photo to the lower left(Fig.3), and is only blocking the direct sun light.
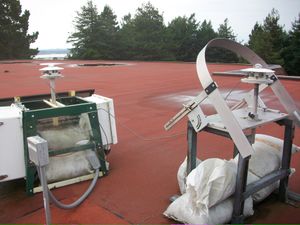
The PSP that is exposed to direct sunlight measures what is called global radiation. This global radiation is a composition of direct radiation, coming straight from the sun directly to the PSP and the diffuse radiation which is other light waves that have been bounced, bent, or reflected though the earth’s atmosphere. The illustration to the right(Fig.4) may help to clarify this concept. The second PSP, with the shadow band blocking the direct radiation, only receives diffuse radiation. By using the data from each of these PSP’s, the diffuse radiation is subtracted from the global radiation to obtain the amount of direct radiation which is the primary source of solar energy.
Becoming A "Primary Site"
Once the SoRMS project was completed, there were some improvements that would take care of the issues found in the system. With these issues fixed, the SoRMS project would become able to collect data for the National Renewable Energy Laboratory(NREL). There were two problems within the operating system, one was the lack of a backup PSP. Every two years the Eppley Precision Spectral Pyranometers have to be sent back to the National Renewable Energy Laboratory for recalibration. This process takes two monthes, putting the data logging on hold for that period of time. The proposed solution was to purchase another PSP, making it possible to have a continuos data log at all times throughout the year.
The next issue with the SoRMS project was its lack of direct access by the NREL. With a direct link to NREL, the SoRMS project would be able to become a primary solar monitoring site. A "primary site" is what the NREL calls the various locations from where they get their national data. The SoRMS project provide data for California's North Coast, an area that the NREL does not have any measured data. There were two proposed solutions for this problem. The first solution was to set up a radio transceiver/receiver and antenna to transmit the data to another location with internet access. From the receiving location, the data would be sent to NREL. The alternative to this was to install an ethernet jack on the library roof, and transmit the information directly from SoRMS. This solution was the preferred solution, as it involved less variables to slow down relaying data. The project now has 3 PSPs and a direct link to the NREL via ethernet cable.
How To Access Data
With the operating issues eliminated, the SoRMS project now submits data to the NREL. The data that SoRMS produces is collected by a Campbell ScientificCR510 data logger, and connected to the internet using a NL-100 Network Link Interface. With this Network Link Interface, the information collected by the SoRMS project is now promptly accessible to the public as Daily Charts and in a Calendar View. It also allows the National Renewable Energy Laboratory access to download SoRMS data remotely which also has a link to the data. Below is the graphical interpretation of a day's data(Fig.5).
Making Use Of SoRMS Data
With access to information on the direct radiation in the area, one is able to make use of it in many ways. By averaging the daily data, one can calculate average daily solar radiation. This can be of use to engineers building passive solar power in the area, as they can get an idea of energy input and determine the necessary scale of the operation. If there is not much solar radiation in the area, there would be more panels to produce a necessary amount of power. With more radiation in the area, there would not need to be as many panels for the same energy output. Local farmers and gardeners can use the data to decide what crops would be ideal for the amount of sunlight, as well as determine the proper harvest times based on past data. With knowledge of the amount of solar radiation, one can find out when a solar power project would begin to pay itself off, or in some cases if it would payoff at all. The graphs can also be used for recreational purposes. By looking at what time the direct radiation is the strongest, one can predict the most effective time to sunbath, or any activity that would be preferred in peak direct radiation periods, ie; sports, exercising, picnics, ect. To the health consious, or those weary of the suns radiation, one can determine the times that sunblock may be necessary, or when to avoid the sun altogether. With the graphs, one can get an idea of the local climate as well. By noticing frequent short arks, indications that the location is not as sunny, one leads to assume there is often clouds or other forms of weather present in the given location. The opposite can be said about about tall lengthy arks, there would be more sun with less forms of weather obstructing the solar radiation.
How SoRMS Is Run
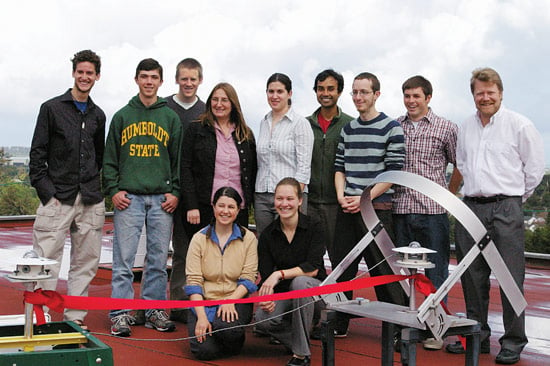
The SoRMS project is run by California's Humboldt State University (HSU), Renewable Energy Student Union (RESU) which collaborates with the Schatz Energy Research Center. All the people working to keep this project running are volunteers. These volunteers keep the information as accurate as possible by maintaining the systems continuity. Seen below is some of the integral people who keep this project going(Fig.6). From left to right, the names are:(Top row) James Robinson, James Apple, Peter Johnstone, Heidi Benzonelli, Andrea Allen, Ranjit Deshmukh, Colin Sheppard, Lucas Siegfried, Arne Jacobson (Bottom row) Kristen Radecsky , Juliette Bohn
Maintaining The Project
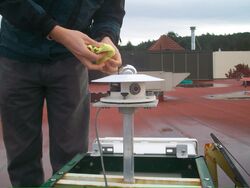
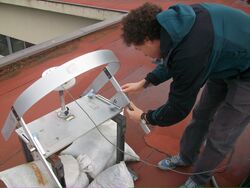
In order to keep this information consistent, every morning one of the RESU volunteers clears the PSP’s of any dew accumulation (Fig.7) and adjusts the shadowband (Fig.8). This dew accumulation, if left on the PSP, can cause short term spikes and holes in the energy absorption due to the light bending as it passes through dew droplets. . The Shadowband is adjusted accordingly year round in relation to the earths rotation and position of the sun. The entire system is powered with the use of solar panels, eliminating operation costs and replacing the need for an attachment to a power grid.
Funding Required
Because this project is maintained by volunteers, and the continuous operation is powered by solar panels, the only funding required is to cover the costs of shipping the PSP’s to the National Renewable Energy Laboratory for recalibration, which is done about every two years. However, the system exists today only because of the initial support of the HSU Sponsored Programs Foundation, the National Renewable Energy Laboratory, Redwood Alliance, Schatz Energy Research Center, HSU's Environmental Resources Engineering department, HSU Plant Operations, Marty Reed - HSU Equipment Technician, and the HSU library staff. [1]
References
- http://resu.humboldt.edu/?q=node/259
- http://solardat.uoregon.edu/EppleyPSP.html
- http://www.eppleylab.com/Radiation.html
- http://www.nrel.gov/midc/hsu/
Beth's Comments
L1,W1 - You are using a lot of "it"s in your headings. Be sure to search on others. L9, CT4, W2, L-10 (for example HSU, RESU, NREL etc) C9. I like the tone and flow of your writing. You could a little more concise. C3!!!! Are you clear about the location of the station? Be sure to include more links to relevant info. Just ask me for input if needed. C- 12 Review this example for format, linking and referencing ideas: http://www.appropedia.org/Arcata_Marsh_chlorination Be sure you have some very descriptive captions. The cost information should probably not be in the maintenance section. I would put the volunteer information toward the end. Please reconsider those headings... the organization of the information is reasonable... but the heading titles need to be more professional. I like the additional of photos. Keep moving toward including the photos in a professional way.
Could have a section on project history... to explain how the project came to be. This project is another example of ERE student initiative and you could highlight that aspect more here.
Good Start!
Codes
L1 People will use the first screen of your web page to decide if they should keep reading. Make sure you have an attractive first screen to draw the reader into your topic. Try to include links or bookmarks to other information in the page at the top of your page. Use introductory paragraphs and/or table of contents to tell the reader how the document or a section of the document is organized.
W1 Avoid using words such as: “thing”, “done”, “be”, “like”, “good”, “bad”, “ones”, “show”, “kind”, “nice” “look”, “ come up”, ”way”, “take”, “being”, “make” “figure out”, “it” “cheap” “really” “got”, “cheap”. Usually you can communicate your idea more clearly if you use a more specific noun, verb or phrase.
L9
Avoid using headings that are questions
CT4
Write for an international audience. Assume you reader does not know about HSU or our area.
W2 Avoid using “this”, “these” or “those” without a noun.
L-10
Link to relevant information within the text the first time the reader comes upon the information
C9 Be sure to cite your references properly. Use APA style as shown here http://www.liunet.edu/cwis/cwp/library/workshop/citapa.htm
C3 Make your figure and table captions as detailed and specific as possible. Be sure to cite source of any figures, tables or images you use.
C-12
Be sure to review this site for ideas of how to use citation, link and reference conventions http://www.appropedia.org/Arcata_Marsh_chlorination?