
No higher resolution available.
BloodSugarHistoryOfUserGeorgedappillyTill13june2011.Ep.op.jp4appro.jpeg (747 × 508 pixels, file size: 164 KB, MIME type: image/jpeg)
Summary
This graph is generated using the blood test results of User Georgedappilly. Period 25 Feb 2006 to 13 Jan 2012. Lab results are with the user.
Licensing
File history
Click on a date/time to view the file as it appeared at that time.
| Date/Time | Thumbnail | Dimensions | User | Comment | |
|---|---|---|---|---|---|
| current | 15:44, 28 January 2012 | | 747 × 508 (164 KB) | Georgedappilly (talk | contribs) | Reverted to version as of 04:57, 20 January 2012 |
| 15:38, 28 January 2012 |  | 747 × 508 (164 KB) | Georgedappilly (talk | contribs) | This picture contains blood sugar results till 13 Jan 2012. | |
| 04:57, 20 January 2012 | 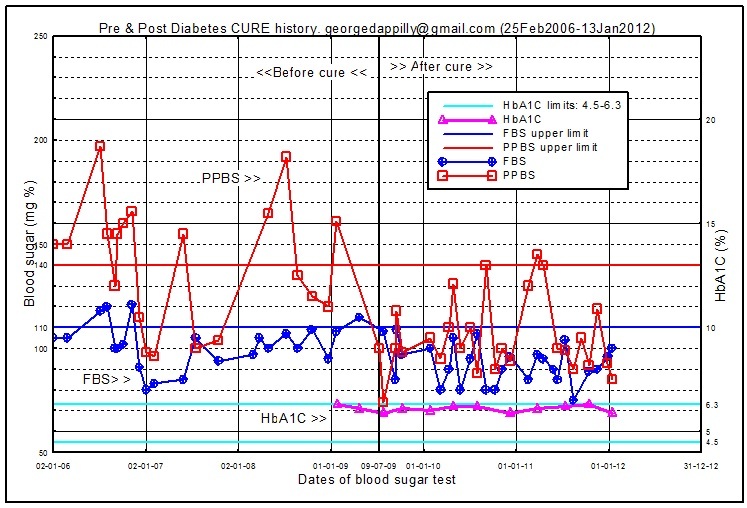 | 747 × 508 (164 KB) | Georgedappilly (talk | contribs) | This picture contains data UP TO 13 JANUARY 2012. | |
| 07:51, 16 October 2011 | 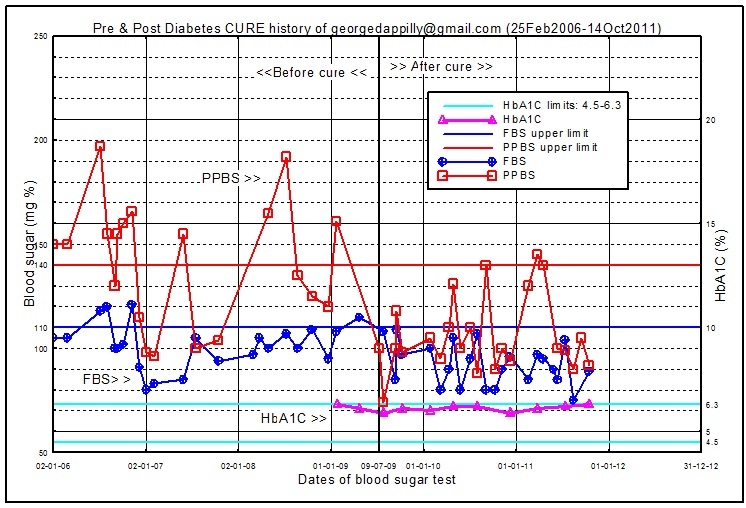 | 746 × 508 (163 KB) | Georgedappilly (talk | contribs) | This contains Test Results of FBS, PPBS & HbA1C till 14 Oct 2011 | |
| 10:40, 25 August 2011 | 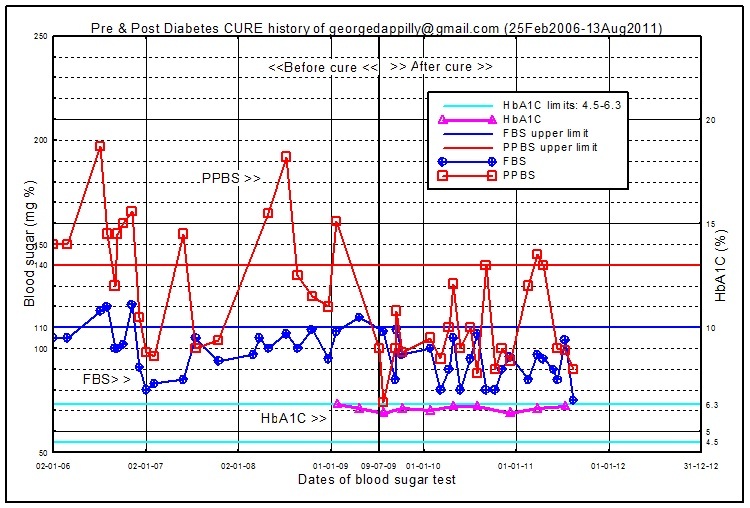 | 750 × 508 (162 KB) | Georgedappilly (talk | contribs) | Data from 14 Jun to 13 Aug 2011 included in the graph | |
| 11:14, 24 June 2011 | 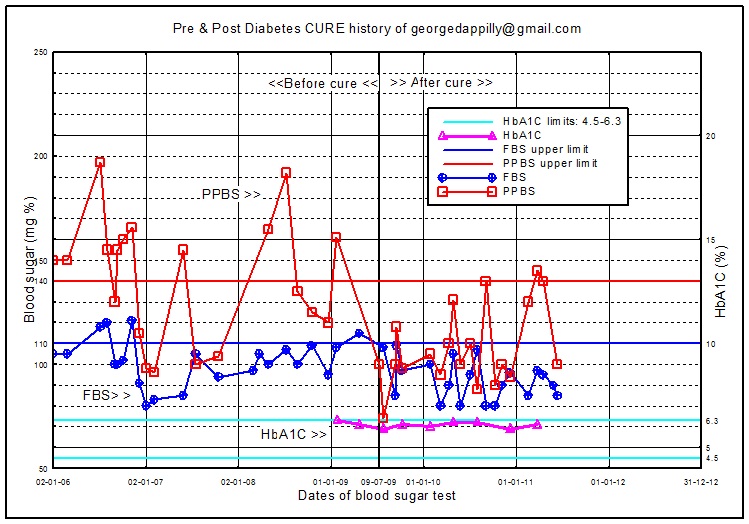 | 749 × 524 (162 KB) | Georgedappilly (talk | contribs) | Incorporated lower & upper limits of HbA1C. They are 4.5(%) & 6.3(%) respectively. | |
| 07:01, 21 June 2011 | 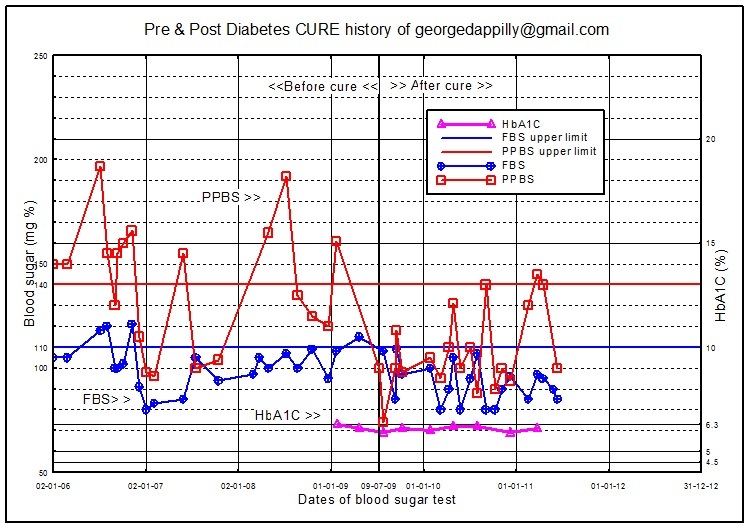 | 745 × 528 (160 KB) | Georgedappilly (talk | contribs) | This graph is generated using the blood test results of User Georgedappilly. Period 25 Feb 2006 to 13 June 2011. Lab results are with the user. |
You cannot overwrite this file.
File usage
The following page uses this file: