Introduction
EllipsometryW is a powerful technique whereby the change in the polarization of light reflecting off a surface is analyzed to determine the optical and dielectric properties of a thin film. This analysis can yield information about layers that are thinner than the wavelength of the probing light itself, even down to a single atomic layer. Ellipsometry can probe the complex refractive index or dielectric function tensor, which gives access to fundamental physical parameters and is related to a variety of sample properties including thickness, morphology, crystal quality, chemical composition, or electrical conductivity.
Unlike single-wavelength (laser) ellipsometry, which uses a monochromatic light beam, spectroscopic ellipsometry (SE) employs broad band light sources which cover a certain spectral range in the infrared, visible or ultraviolet spectral region. SE in these regions studies the refractive index in the transparency or below-band-gap region and electronic properties such as band-to-band transitions or excitons.
SE uses polarized light to determine optoelectronic properties of a material. SE requires some knowledge of the test specimen, such as the number and thickness of films deposited on a substrate transparent in the operating range of the SE.
Background on Ellipsomtry
Texts available in the MOST library
- User's Guide to Ellipsometry by H.G. Tompkins
- Spectroscopic Ellipsometry Principles and Applications by Hiroyuki Fujiwara
- Spectroscopic Ellipsometry notes by R.W. Collins
Equipment
| Ellipsometry Model VWASE VB-400 |
|---|
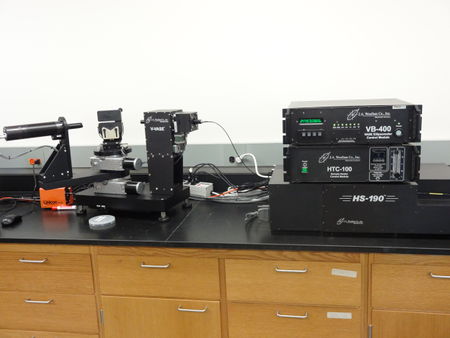 |
The ellipsometer used is a J.A. Woollam variable-angle spectroscopic ellipsometer (VASE). The VASE is connected to a computer where WVase32 software is used for data collection. Data is saved by the program as a .txt file that can be imported into other software, such as Libre Office, for analysis. J.A. Woollam V-VASE ellipsometerW is available for ellipsometry in M&M Room 431 at MTU. General VASE Specifications
J.A. Woollam variable-angle spectroscopic ellipsometer (VASE) Specifications
Hardware Description Our equipment has the following major hardware;
HS-190 Monochromator including the following specifications;
- 75 W light source - high speed monochromator system.
- Czerny-Turner Scanning Monochromator with a focal lenth of f = 160 mm and an effective aperture ration of f/4.5.
- Our standard model has a 250 - 1700 nm spectral range and the DUV upgrade to 190 nm.
Fiber Optic cable Our system uses the fiber optic cable with the following specifications;
- 200 micron diameter core with 25 micron doped silica cladding.
- Fiber is terminated on each end with SMA connector for easy insertion and removal.
- IR fiber transmit wavelenght above 300 nm and,
- Bend radius ≥ 50 mm.
Sample stage Our model comes with the following stages;
- The standard vertical stage capable of holding samples of up to 150 mm in diameter,
- HTC - 100 Heat Stage (Room Temperature to 300 degrees Celsius),
- 6" X-Y stage for sample mapping, and
- sample Rotator stage for high precision sample rotation (3600 theta only) for studying anisotropy.
Our system is also incorporates a 0 - 3600Auto Retarder and a fully automated 20 -900 Angle of Incidence.
Before you can start
Before you can use the ellipsometer, you must pass a safety training quiz for the MTU Microfabrication Facility. If you are interested in becoming trained to use this equipment, talk to Dr. Pearce then please email: Paul Bergstrom (paulb@mtu.edu) or Bill Knudsen (wknudsen@mtu.edu) in order to get more information.
Before independent use of this equipment can be done, you must become certified. A training program of (3 observations/3 operations) must be done before a practical exam is ran. After the practical exam has been passed, you may begin operating the equipment independently.
The following method is used in order to do ellipsometry (as taught during the training).
Powering-On the System:
| Ellipsometry Control Panel |
|---|
 |
STOP!LOG-IN FIRST. The log book is always in the lab.
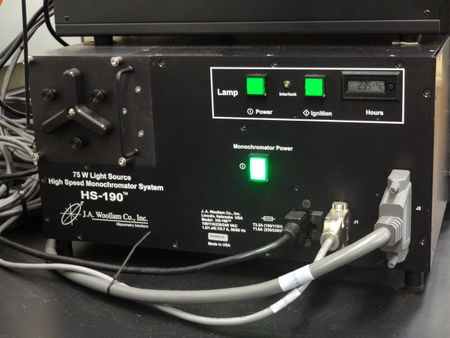
Turn the LAMP Power ON (on the ellipsometer control panel (see image))
Turn IGNITION ON (Switch located next to the LAMP Power switch)
Switch-ON the Monochromator Power
Open Program WVASE32 from desktop and Click on HARDWARE screen
Remember to PUT ON GLOVES at this stage.
System Calibration Procedure
- Open Calibration Case, and
- Remove Calibration Sample
- Turn on vacuum while loading (switch is located below the stage)
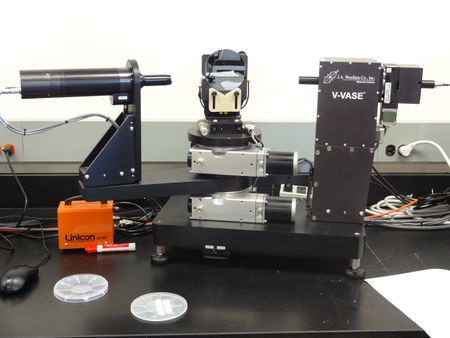
- Place Calibration Sample on stage
| Calibration Sample on Stage |
|---|
 |
Hardware Initialization
On the Toolbar click on "Initialize" to begin hardware initialization.(Wait as this may take a few minutes)
- Type in your username when prompted starting with your First Name and Last Initial.
Go to the Toolbar and click on Acquire Data followed by Align Sample.
Aligning the Sample
You will be prompted to place a red (+) at the center of the cross lines(on desktop).
- get to within +0.5 and -0.5 of the origin (in both y- and x-axis).
For y-direction alignment
- Adjust top knob on back of ellipsometer to level gray bars and align vertically
For x-direction alignment
| Calibration settings |
|---|
 |
- Adjust bottom knob on back of ellipsometer to align horizontally
- Hit ESC when aligned to accept
Maximizing the intensity
You will be prompted to <Maximize Intensity.>
- Hit OK
- Adjust front gray knob for z direction
A line will run across the screen,
- Maximize the intensity by getting this line to peak value.
- Hit ESC when maximized to accept
Calibration
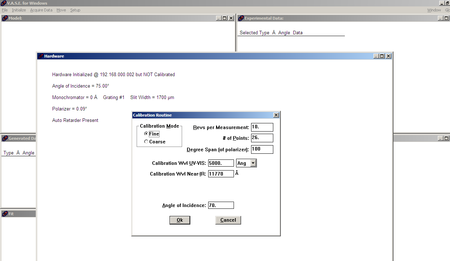
Go to:Toolbar -> Acquire Data -> Calibrate System
- Click OK on screen that pops up
- Wait until calibration process is complete (may take a min or more).
- Remove calibration sample by holding and turning off vacuum
- Put into calibration sample case face down and close
Spectroscopic Scans
Load test sample on the stage (as in the previous case).
- Turn on vacuum (it it was turned -off after calibration).
- !!Make sure the vacuum is strong enough to hold the sample on stage!! -- test sample with a pair of tweezers before releasing.
- Switch hose on back of ellipsometer sample stage to another nozzle for a greater suction power or bigger samples sizes.
Repeat the alignment and intensity maximization procedures as outlined above.
Go to; Toolbar -> Acquire Data -> Align Sample
- Hit OK to dialog screen
- Adjust x and y as outlined above (refer to calibration above)
- Hit ESC when done
- Adjust z for intensity maximization(refer to calibration above)
- Hit ESC when done
Performing Spectroscopic scans
Go to; Toolbar -> Acquire Data -> Spectroscopic Scan
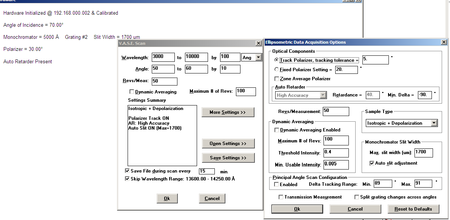
- Set scan parameters ( click on the image to view a sample of scan settings)
| Spectroscopic Scan Settings |
|---|
 |
- After parameters are set hit OK
- Hit OK to dialog screen that pops up
- Choose directory on computer in which to save the scan results.
- Name sample e.g. SiO2 for an oxide sample scan; a-Si for amorphous Silicon sample etc.
- Hit OK to initiate scans.
Scan Duration
- ~5 min for Isotropic
- ~30 minutes or more for Isotropic + Depolarization
Take off sample/turn off vacuum
- Put away sample
Closing Down
When finished with all scans:
- Turn off LAMP POWER
- Exit program
- Log out
- Fill out Logbook
Data Analysis and Modelling
After scan completes, the next step is to build a model.
It is important to keep your model as simple as possible but not simpler. For more accurate results when dealing with complex structures, it is recommended to model each individual layer independently!!
Detailed documentation on step by step data analysis and model building is available upon request.
Building a Model(This is just a general description)
Before building a model, it is necessary to know;
- The number of layers in the sample (which may include roughness layers),
- Identity of different layers, and
- Approximate thickness of each layer.
| Model Window |
|---|
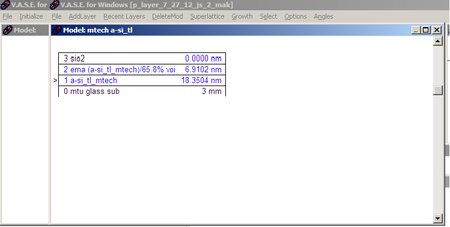 |
Click on Model Window (on desktop)(See Fig.4)
Then go; Toolbar -> Add Layer
- Start by adding your first layer, e.g. If your sample is substrate + Oxide film;
- Using general material name, found in the database, add layer;
- ie. Si.mat for silicon, a-si.mat for amorphous silicon, or glass for a glass substrate
- then add next layer following the same procedure as for the substrate.
- You can also build multiple layered models depending on your sample. See the Model window for one of our sample scans (p-layer on glass)
Note: you can delete and add a different layer during model building using "Add/Delete layer from the toolbar.
- OR add multiple layers using previous scan information from proper directory
- Type in approximate thickness of layer.
Data Analysis
After adding layer on top of substrate and entering the approximate layer thickness;
| Experimental data |
|---|
 |
- Check fit (leaving n & k unchecked)
- Hit OK
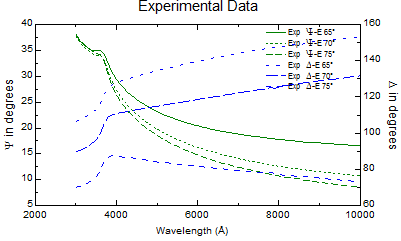
- Hit CTRL F to fit (to Compare the modeled and experimental data)Refer to figures on the right.
- Hit OK
- Adjust the model parameters, and
Continue fitting until model fits experimental and errors are minimized
| Generated and Experimental data |
|---|
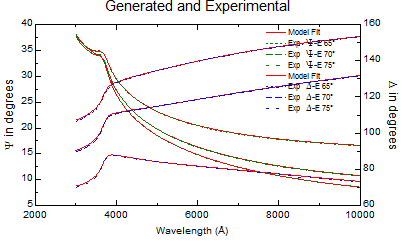 |
See figure of fitted acceptable results.
"Data mining process"
To obtain further data from the fitted model;
- Hit CTRL + T;
- Once, to get pseudo values of epsilon 1 & 2
- Twice, to get pseudo values of n & k
- Three times -> real values of either e1 & e2 or n & k
Specifying Optical Constants and units of layer thickness
| VASE Defaults window |
|---|
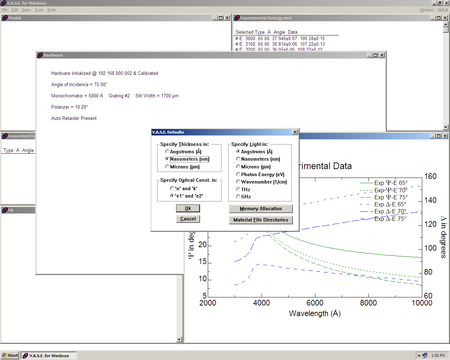 |
- Hit CTRL + D and you get the window shown in the figure.
From the VASE defaults screen
- Select e1 & e2 to obtain the graph of variation of e1 & e2 with wavelength, or
- n & k values to obtain --> Variation of n & k versus wavelength.
Note: You can also get raw epsilons, n and k data and save it as text or excel files.

