Anonymous1 (talk | contribs) |
Anonymous1 (talk | contribs) |
||
| Line 127: | Line 127: | ||
where <math>A_{pv}</math> is the photovoltaic footprint (m<sup>2</sup>), <math>C_{pv}</math> is the desired photovoltaic capacity (kW), and <math>\rho_{pv}</math> is the photovoltaic power density (kW/m<sup>2</sup>) . In the second equation, <math>E_{pv}</math> is the solar energy produced by the photovoltaic array (kWh/month), <math>\epsilon_{pv}</math> is the photovoltiac sunlight conversion efficiency, <math>\rho_{sun}</math> is the available solar energy density (kWh/day/m<sup>2</sup>), and <math>N_{month}</math> is the number of days in the average month. In the third equation, <math>E_{grid}</math> is the grid energy required to satisfy the portion of the demand not met by the solar resource (kWh/month), and <math>E_{demand}</math> is the total household energy demand (kWh/month). | where <math>A_{pv}</math> is the photovoltaic footprint (m<sup>2</sup>), <math>C_{pv}</math> is the desired photovoltaic capacity (kW), and <math>\rho_{pv}</math> is the photovoltaic power density (kW/m<sup>2</sup>) . In the second equation, <math>E_{pv}</math> is the solar energy produced by the photovoltaic array (kWh/month), <math>\epsilon_{pv}</math> is the photovoltiac sunlight conversion efficiency, <math>\rho_{sun}</math> is the available solar energy density (kWh/day/m<sup>2</sup>), and <math>N_{month}</math> is the number of days in the average month. In the third equation, <math>E_{grid}</math> is the grid energy required to satisfy the portion of the demand not met by the solar resource (kWh/month), and <math>E_{demand}</math> is the total household energy demand (kWh/month). | ||
'''Cash Flow''' | |||
''' | |||
to be written | |||
'''Financial Parameters''' | '''Financial Parameters''' | ||
| Line 188: | Line 139: | ||
! Parameter | ! Parameter | ||
! Description | ! Description | ||
! Value | ! Suggested Value | ||
|- | |- | ||
| Project Lifetime | | Project Lifetime | ||
| Line 196: | Line 147: | ||
| Discount Rate | | Discount Rate | ||
| Generally described as the time-value of money associated with investment alternatives and the depreciation of purchasing power. | | Generally described as the time-value of money associated with investment alternatives and the depreciation of purchasing power. | ||
| | | 15 % | ||
|- | |- | ||
| Debt Ratio | | Debt Ratio | ||
| Line 204: | Line 155: | ||
| Debt Rate | | Debt Rate | ||
| Annual interest added upon the debt owed to the financier. | | Annual interest added upon the debt owed to the financier. | ||
| | | 25 % | ||
|- | |- | ||
| Debt Term | | Debt Term | ||
| Line 220: | Line 171: | ||
'''Financial Summary''' | |||
'''Financial | |||
Various indices are used to judge the feasibility of each scenario, each index highlights a unique aspect of the risk associated with investment and/or financing of such projects: | Various indices are used to judge the feasibility of each scenario, each index highlights a unique aspect of the risk associated with investment and/or financing of such projects: | ||
| Line 261: | Line 183: | ||
| Net Present Value ($) | | Net Present Value ($) | ||
| The equivalent value of the project at the end of its lifetime, after discounting cash flows that occur throughout the project lifetime. | | The equivalent value of the project at the end of its lifetime, after discounting cash flows that occur throughout the project lifetime. | ||
| Savings + Rebates - Debt - | | Savings + Rebates - Debt - Downpayment - Maintenance | ||
|- | |- | ||
| | | Buyback Time (yrs) | ||
| The amount of time it takes to recover the initial investment. | | The amount of time it takes to recover the initial investment. | ||
| <visual | | <determined by visual inspection of cash flow> | ||
|- | |- | ||
|} | |} | ||
Revision as of 16:50, 14 July 2011
Introduction
Residential households in Santo Domingo, Dominican Republic, experience high grid-energy costs and unreliable grid-energy supply due to several factors. While many of these factors are systemic and not in the control of the general public, the island nation enjoys several unique characteristics that could make the economic viability of residential solar electricity generation a reality. The objective of this study is to determine the physical- and financial-feasibility of installing photovoltaic panels to satisfy a portion of the existing energy demand at a representative middle-class household in Santo Domingo.
-
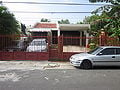
The case study middle class home.
-
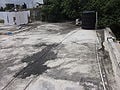
Roof at case study home.
-
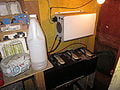
The existing battery bank and inverter at case study home.


Energy Profile
- DR island nation that imports 86% of its combustibles for electric power generation.
- 3% of GDP in 2008 went to subsidize the losses of the grid
- Frequent blackouts/brownouts
- Structural problems (Gov't middle man between private generation and residential use) (Capacity of the grid)
- Lots of illegal connections
- low collection on bills
Residential Photovoltaic System
The residential photovoltaic system under consideration consists of an array of roof-mounted photovoltaic panels, a battery bank in which to store energy for on-demand use, and an inverter capable of charging the battery bank using the energy supplied by the photovoltaic panels and/or the existing local grid.
Assumptions
- One home is chosen as a case study. This home has to be middle class and own a battery bank capable of satisfying 22 hours of autonomy and an inverter.
- Average energy usage is calculated by an audit conducted by the team under the supervision of it's residents. This data is verified by the most recent electricity bill.
- Residents will remain in this house and their energy usage will remain constant.
- Law 57-07 will stay in effect for at least the first three years of the projects lifespan.
- Increasing electricity tariffs will follow the predicted forecasts for crude oil in the global market. As crude oil is the main imported fuel stock used to generate electricity in the Dominican Republic.
- Financial parameters are assumed constant throughout project lifetime. See tab on Google spreadsheet.
- Project lifetime is twenty years.
- Prices of hardware are representative of market value.
- Excess energy generated is not sold back to the grid.
Data Sources
Environmental
Meteorological data including average solar insolation for the city of Santo Domingo is provided by RetScreen[1], a Canadian renewable energy program. This data comes from ground monitoring stations and/or from NASA's global satellite/analysis data.
Financial
Taking out a loan contributes to the viability of the project. Assume banks allow for a five year debt term at 10% interest. This assumption is supported by the fact that the debt service coverage ratio is greater than one for all cases meaning, the revenue generated by the solar project is great enough to cover the annual debt.
Legislative
Law 57-07[2] passed in May 2007 provides incentives to public and private projects that demonstrate financial, environmental, technical and physical viability. This law expressly encourages the installation and exploitation of pre-approved photovoltaic systems with no restriction on production. Incentives include:
- Exemption of import duties for all equipment necessary to generate energy from renewable source
- Exemption of ITBIS for certain equipment expressly listed in the law
- 5% reduction on interest on foreign financing on renewable energy projects
- A single tax credit of up to 75% on the cost of capital equipment used in pre-approved projects that change to or expand the use of renewable energy in residential, commercial, or industrial establishments. The tax credit is apportioned over a three- year period at the rate of one-third per year
Spreadsheet
A google spreadsheet was developed to model the relationship between: historical energy use, energy-based objectives, hardware specifications, financial parameters, and the associated measures of project feasibility (See ).
Model Parameters and Sight Data
The flow of information begins on the 'Model Parameters' and 'Site Data' tabs. On the Model Parameters tab, the spreadsheet user may input financial parameters (e.g., inflation and financing options), hardware specifications (e.g., efficiencies and costs), and options for the analysis (e.g., whether to assume a pre-existing inverter and battery bank). On the Site Data tab, supply and demand for solar energy are listed for a representative year. Monthly demands are listed in a format as you might find on an energy-bill, while suppy is listed in terms of the available daily solar-energy per unit area during each month of a typical year.
Autonomous Runtime
On the model parameters tab, the 'desired autonomous runtime' is the duration over which a fully-charged battery bank will satisfy household energy needs before requiring recharge (e.g., the maximum number of hours between periods of recharge). This parameter, along with battery specifications, determines the size of the battery bank. Assuming the bank will be recharged each day by solar energy, an autonomous runtime between 12-24 hours is considered a reasonable target. The spreadsheet will determine the appropriate bank size via a 'trial and error' process, using the following math:


where is the bank capacity (kWh), is the number of batteries included in the bank, is the Amp-hour rating per battery, is output voltage per battery, and is the reccomended depth of discharge (usually between 70-80 % for a deep cycle battery). In the second equation, is the autonomous runtime (hrs), is the average daily energy demand per household (kWh/day), is the chemical conversion efficiency per battery, is the DC-AC inversion efficiency, and is the loss in efficiency due to miscellaneous factors (e.g., distribution-losses).


Design Criteria
The 'Design Criteria' tab lists the target photovoltaic power-capacity (blue cells) for each of five design scenarios. These power-capacities are calculated according to the supply and demand information on the 'Site Data' tab. The scenarios are described by the following table:
| Case | Description | Equivalent PV Energy Production |
|---|---|---|
| 1 | Supply enough energy to meet average annual second tier demand | average daily 2nd tier energy demand |
| 2 | Supply enough energy to such that second tier energy is never purchased | 3 standard deviations above average daily 2nd tier demand |
| 3 | Supply as much energy as possible without ever exceeding demand | 3 standard devations below average daily demand |
| 4 | Supply enough energy to meet average daily demand | average daily demand |
| 5 | Supply enough energy to go off-grid | 3 standard deviations above average daily demand |
System Design
A system design summary is listed for each scenario on the 'System Design' tab. Given the target PV power-capacity for each scenario, the spreadsheet is programmed to estimate the associated average monthly energy production, as well as the average monthly grid-energy required to satisfy the portion of the household demand not met by the photovoltaic system.


where is the photovoltaic footprint (m2), is the desired photovoltaic capacity (kW), and is the photovoltaic power density (kW/m2) . In the second equation, is the solar energy produced by the photovoltaic array (kWh/month), is the photovoltiac sunlight conversion efficiency, is the available solar energy density (kWh/day/m2), and is the number of days in the average month. In the third equation, is the grid energy required to satisfy the portion of the demand not met by the solar resource (kWh/month), and is the total household energy demand (kWh/month).


Cash Flow
to be written
Financial Parameters
The financial analysis is driven by several parameters listed in the table below.
| Parameter | Description | Suggested Value |
|---|---|---|
| Project Lifetime | The effective life of the PV Panels. | 20 Years |
| Discount Rate | Generally described as the time-value of money associated with investment alternatives and the depreciation of purchasing power. | 15 % |
| Debt Ratio | The fraction of project capital which is raised via financing and subject to interest payments. | 50 % |
| Debt Rate | Annual interest added upon the debt owed to the financier. | 25 % |
| Debt Term | The duration in which loans must be repayed. | 5 yrs |
| Recovery Rate | The fraction of hardware costs subsidized in the form of tax returns | 75 % |
| Recovery Term | The duration in which the recovery rate is acheived | 3 yrs |
Financial Summary
Various indices are used to judge the feasibility of each scenario, each index highlights a unique aspect of the risk associated with investment and/or financing of such projects:
| Parameter | Qualitative Description | Quantitative Derivation |
|---|---|---|
| Net Present Value ($) | The equivalent value of the project at the end of its lifetime, after discounting cash flows that occur throughout the project lifetime. | Savings + Rebates - Debt - Downpayment - Maintenance |
| Buyback Time (yrs) | The amount of time it takes to recover the initial investment. | <determined by visual inspection of cash flow> |
| Case | Buyback Time | Equity Required (US$) | Net Present Value (US$) |
|---|---|---|---|
| Case 1 | NEVER | $330 | -$850 |
| Case 2 | 8 yrs | $660 | $5,270 |
| Case 3 | 6 yrs | $1,650 | $23,630 |
| Case 4 | 5 yrs | $1,980 | $29,750 |
| Case 5 | 7 yrs | $2,960 | $31,530 |
Contributors
- caribe solar
- wilson medina
- abogado
- Vanessa Callas