
Background
The Campus Center for Appropriate Technologies (CCAT) house at Humboldt State University in Arcata, California has a variety of solar powered projects on site.
Our Engineering 305 project for the Spring 2014 semester is to provide CCAT with a data logging system that will track the voltage generated by the photovoltaic (PV) panels on the roof of the CCAT house, and upload that information onto their website.
CCAT has asked that we create a real-time energy monitoring system for the PV panels on the roof of the CCAT house. The information that has been tracked by these PV panels must be accessible to all users on the internet through the CCAT or Appropedia website in a simple, easy-to-read manner.
-
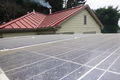
Solar Panel powering the CCAT house, located on the rooftop of the main house
-
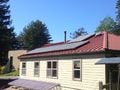
Solar Panels on the Rooftop of the CCAT house


Currently, the CCAT house has 8 PV panels on the rooftop of the main house. These panels are the same ones that were generously donated by ASE Americas back in 2001, and remounted onto the rooftop when CCAT moved locations in 2008. The Inverter Currently Installed at CCAT is a Magnetek Aurora 3600-US-OUT. The company Magnetek has since been bought by Power-One. The Power-One Aurora 3600-US-OUT installation manual can be found here.

The 8 solar panels on the rooftop are wired together in 2 strings of 4, mainly because the panels were previously hooked up to two separate inverters. Since there is only one inverter, both strings of the 4 solar panels had to be wired together in series, and hooked up to the one updated inverter through the "PV Input 1" port on the Magnetek Aurora inverter. Instead of re-wiring the panels on the rooftop when replacing the two old inverters with the most current Magnetek Aurora inverter, Solar Roger, the local solar electrician/installer, decided to just splice these wires together.
This way, the 2 strings of 4 solar panels wired separately on the rooftop are merged together in series, into one continuous string, connected to the input of the one Magnetek Aurora inverter.
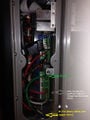
The current CCAT Photovoltaic system is shown below through images of the DC disconnect box, the box of wires below the inverter, and the Magnetek Aurora inverter.
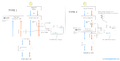
Notice the box of wires has a splice where the red wire meets the white wire. This is where the solar panels are connected together in series. The Wiring diagram (below) is from 2014, and is an accurate record of the current system.
-
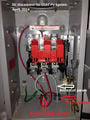
DC disconnect box
-
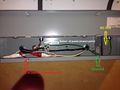
Box between the DC disconnect box and the inverter
-
Side view of the Magnetek Aurora Inverter


Problem statement
The objective of this project is to develop a data monitoring system to capture the electricity generation collected from the photovoltaic panels on top of the CCAT roof at HSU and display it online in kWh's. This will be accomplished by researching and determining the best software and hardware to install, allowing CCAT officials to store the solar power data and access it at any time. Ideally, with the most appropriate technology software and monitoring system chosen, any one will be able to track data throughout the day, and see visual graphs representing data patterns over time.
Criteria
The plan is to install PV monitoring hardware and software at the CCAT house located at Humboldt State University. The data must be downloaded to or streamed through a device that will upload the information to the CCAT website and be available 24/7 to anyone interested. The software must be user friendly and relatively inexpensive.
| Criteria | Weight (1-10) | |
|---|---|---|
| Accessibility | Solar data from CCAT must be streamed online in kWh, and must be accessible to any one online | |
| Low maintenance | Solar controls must automatically upload information to the CCAT or Appropedia website to display logged solar data | |
| Budget | Must not exceed budget of $1,000 | |
| Real time data | Data must be graphically represented on the CCAT or Appropedia website, and updated at least twice per day, and at most, in real-time | |
| Ease of use | Graphical representations of data must be easy to follow, and software must be easy for CCAT co-directors to navigate, if necessary | |
| Aesthetics | Graphs must be pleasing to the eye, look professional, and be easy to read |
Time Table of Tasks
| Task | Week completed |
|---|---|
| Research | Week 07, Friday, 03/07/14 |
| Shopping | Week 08, Friday, 03/14/14 |
| Learning Arduino | Week 10, Friday, 03/28/14 |
| Programming Arduino | Week 13, Friday, 04/18/14 |
| Installation and Testing | Week 15, Friday, 05/02/14 |
| Create YouTube Video | Week 16, Friday, 05/09/14 |
| Finalize Appropedia page | Week 16, Friday, 05/09/14 |
| Showcase final product to CCAT and ENGR 305 class | Week 17, Friday, 05/16/14 |
| Project Completed | Friday, May 16, 2014 |
Our Design
The cheapest, most versatile option for this design is to connect directly to the inverter through its' RS485 connection. Currently, the Magnetek Aurora inverter has data logging capabilities and can translate that data to Aurora Monitoring software. That monitoring software presents the electricitiy generation data grpahically in real-time, but it is bound to the local computer hook-up only, so it does not upload to the internet, it is just stored. We found a way to take this sheltered information and transfer it online where it can be accessed by all, using open-source software and a mini computer board that can take that data onto CCAT's website.

Hardware
Our plan is to connect a Raspberry Pi to the inverter through an RS485 to USB cable. The RS485 to USB cable transfers the logged data from the Magnetek Aurora inverter to the Raspberry Pi, which is a small computer encoded with open-source software. That open-source software will transfer the inverters' logged solar power data online from the Raspberry Pi network plug to the Local Area Network (LAN) connection located in the CCAT house. Eventually, we will have HSU's Telecommunications crew install a LAN connection in the downstairs storage closet where the inverter and Raspberry Pi will reside.
Software
Once the data from the inverter is sent to the LAN, we will use open source software to translate that Aurora monitoring data onto a website called PVoutput.org. This website will graphically show how much electricity is being generated by the solar panels in 5-minute intervals.
This option will cost no more than $100, and will be an excellent opportunity to demonstrate the capabilities of open-source software to meet our needs. Also, this project can be replicated to fit the needs of a variety of different PV panel applications.
Costs
| Quantity | Material | Source | Cost ($) | Total ($) |
|---|---|---|---|---|
| 1 | Raspberry Pi | Amazon.Com- Raspberry Pi (free shipping) | 39.00 | 39.00 |
| 1 | Raspberry Pi Case | Amazon.com- Raspberry Pi Case (free shipping) | 9.00 | 9.00 |
| 1 | RS485 to USB cable | Mouser.com | 42.50 +shipping | 49.49 |
| 1 | Micro USB power cable | mybigcommerce.com- Micro USB cable | Donated | 0.00 |
| 1 | 5V USB Power Adapter | ebay.com- USB power adapter | Donated | 0.00 |
| 1 | RJ-45 cable | Donated | 8.00 | 0.00 |
| Total Cost | $97.49 | |||
Project goals
Our goals are to successfully upload electricity generation of CCAT's 8 rooftop solar panels onto the internet for public access. This project includes the following steps:
- Learn about the CCAT PV system
- Learn about the Raspberry Pi
- Learn how to program the Raspberry Pi with open-source software
- Get project idea approved by Information Technology Services (ITS) at Humboldt State University
- Get project approved by CCCAT Co-Directors, CCAT Key Advisor, and HSU's Director of Sustainability
- Get the kWh data from the Aurora Inverter to the world-wide-web
- Embed the Aurora Monitoring Program code onto the CCAT website
Design Implementation
Discussion
With 3 design changes, we have learned a lot about the University requirements, CCAT's PV system, and how many different software programs and components work together to log energy generation data and monitor that data online.
What we learned through Information Technology Services (ITS) at Humboldt State University
ITS at HSU requires approval for any wireless router to be installed on campus. If the frequency of the wireless signal is 2.4 Ghz or between 5.0 to 5.7 Ghz, the request will automatically be denied, as it will interfere with the IT system on campus. Most of the wireless routers we found to transfer local data information to a web server were around 433 Mhz, like the Efergy Energy Monitor for example, and are "good to go", according to ITS.
Literature Review
Arduino Compatible Systems
An arduino is an open source logic controller, which can be programmed to be used in a wide variety of ways. Typically, they are used to track data changes over time or to manipulate electronics to perform in any way you desire by encoding the arduino. The arduino is awesome because any one can make amazing ideas come to life in the realm of the electronic world.
Open Energy Monitor and EmonCMS
Open Energy Monitor is an end-to-end open-source website that provides step-by-step instructions for many home PV monitoring systems using an Arduino, an Arduino base, CT sensors, and EmonCMS open-source software to transfer the data graphically, in real-time, to a personalized dashboard, which can be embedded into any website.
[5]

Solar Data Logging/ Hardware Components
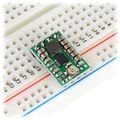
emonTx Arduino Shield V2 SMT
emonTx Arduino shield is a component that is added to the Arduino system to receive or transmit energy data. It features:
- Apparent Power, Real Power*, Power Factor* and AC RMS voltage readings*
- 4x Clip-on CT current sensing inputs
- 1x AC-AC 9v Adapter input for AC voltage measurement and realpower calculation
- 1x on board DS18B20 temperature sensor footprint
- 2x DS18B20 terminals available via terminal block.
- 433/868Mhz RFM12B (HopeRF) wireless transceiver to transmit/receive data to other OpenEnergyMonitor and JeeNode modules
- Status LED
Web-based systems
The Owl
The Owl is a system that has been developed to take data from PV panels and display this information on a website and a smart phone. The Network OWL gateway automatically logs all of your consumption and generation data securely within the Intelligent Cloud software platform. You can then login to view your live and historic data, from any Internet connected computer, anywhere! Or if you wish, access OWL Intuition-pv on your smartphone using the dedicated iPhone or Android app - both available for free download. The Network OWL gateway simply plugs into your existing broadband router and wirelessly links with the Transmitter and two Sensors. We are still not sure if this program can be accessed through the CCAT or Appropedia website, which is a necessity for the project.

[7]
EcoWatt
Eco-Watt provides real-time performance monitoring for solar panels. Data is updated every 5 minutes to Ingenero website with a user login. This system is not ideal because we want the data displayed live on the CCAT and Appropedia website without login requirements.
[8]
Alternative Designs
Alternative Design 1
Our design will be small, simple and easy to manage. We hope to install up to 3 devices on 3 different solar panels and have them all transmit the kWh's to a router inside the CCAT building that feeds the data onto the internet.
- Sample gallery
-
Our system is Type 2
-

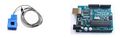
We will use Arduino.
-
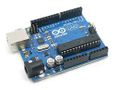
Arduino Uno is the hardware we chose.
-
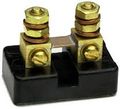
Our design will require a shunt.
-
Our design will require voltage step-down.
-
CT sensors will be necessary to feed data to our Arduino Uno.


We will use a Type 2 design on the OpenEnergyMonitor website. The OpenEnergyMonitor power adapter products are from the UK, so we will need to find a 5 Volt USB AC to AC adapter that will work in the USA. This is our best option. <Specification of 2.1A Dual USB Travel Wall Charger Adapter, Input: AC 100V-240V (50/60Hz), Output: DC 5V/2.1A, Plug : US plug>
[A simplified version of an Arduino system can be found here.]
[An instructables example of a home Arduino Shield system can be found here.]
[A useful info. guide for getting started with Arduino can be found here.]
We will need to install the Arduino IDE software.
Based on steps provided by the OpenEnergyMonitor guide, this is how our system will work:

Costs
Base Station
For our design, we will need a base station. The base station is necessary in order to transmit data wirelessly from the PV system to the internet. The base station we chose for CCAT is the Nanode RF. The base station shall be set up first, so that any sensor nodes connected to it can transmit the data automatically. We will need a 5V FTDI cable to transmit this information.
Wireless Node
The wireless sensor node we are choosing to hook up to is the emonTX Shield V2. This option is an arduino shield footprint compatible, electricity and temperature monitoring shield that can be connected to any standard Arduino UNO. We chose this option because it is compatible with the Arduino UNO that we already have.
The other option available is the emonTX V2 energy monitoring transmitter unit kit, which is a low power wireless energy monitoring node designed to sense data from multiple CT current sensors, optically from a pulse-output utility meter and from multiple one-wire temperature sensors. It can be powered by a 5V USB. Build an Arduino Shield
Programmer USB to UART
The USB to UART programmer is required for uploading Arduino software sketches and reading serial data from emonTx, emonGLCD emonBase / Nanode/RF. This programming cable performs the same function as an FTDI cable but use a different chipset. No driver required for Linux. Mac / Windows drivers can be downloaded at the website above, Mini-usb cable is additionally required.
Alternative Design 2
The other option, which is more complicated, would be to purchase an Aurora protocode to MODBUS RTU adapter, which would directly transport the data from our inverter onto the CCAT website. We did not choose this option, because it would require a computer software technician to program an interface to take the data and present it in a graphical manner on the website, which is beyond the scope of this project.
Alternative Design 3
Aurora Vision Software and Aurora Vision Data Logger
After consideration of many alternative systems, our final design will be using the Aurora Vision Software, which interfaces with the Aurora Vision Data Logger. This data logger will need to be purchased by Power-One, and will cost around $500. We chose this option because the current CCAT PV system includes a Power-One Aurora Inverter, which is compatible with the Power-One data logger and Aurora Vision software. We chose this option because it is the simplest design, has the least amount of components that could possibly fail, and is simple enough for new Co-Directors to adopt and maintain throughout the life of the CCAT PV system. The data logger captures the data from the inverter, and sends this information through an ethernet cable, which taps directly into our campus' Local Area Network (LAN). The data logger sends this data continuously to the Aurora Vision One data center, which stores the energy generation of our PV panels forever, with a life-time clock. This system captures information in 15-minute intervals, which is not real-time time, but is manageable for storage in an off-site data center. The Aurora Vision dashboard is a Power-One URL website, which can be linked onto the CCAT website as a hyperlink, or we can use HTML iFrame elements to embed the Aurora Vision ezView website onto the CCAT website for easier accessibility.
The components will be connected to the PV system like this:
PV Panels--->Inverter--->Data logger--->RS485 cable--->LAN--->MAC address--->Aurora Vision Dashboard--->iFrame embed code--->CCAT's website
Alternative Design 4
The Energy Detective

The Energy Detective 5002-G was chosen because it is inexpensive, tracks electricity generation from the solar panels and electricity consumption from the house. The TED takes this information, and graphically translates it onto a free website. The data is tracked in real-time, and the TED server can track historical information for up to 10 years. The product comes with a 1 year warranty, and free customer support online.
The TED device hooks up to the AC lines in the CCAT house at 2 points, using two separate MTU/CT's. The MTU/CT sensors send the data to 2 measuring transmitting units, which send that data to one Gateway, embedded with Footprints software. It is recommended by TED's technical support staff that we install one plug-in filter and one in-line filter to our system, which will prevent any interference that the PLC communicator might cause to an inverter, or electrical components used at CCAT.
The installation guide for this product can be found here. Website specification for this product are:
- TED 5000 series is only suitable for use on 120/240V single-phase 60Hz services.
- TED is only suitable for services of 200 Amps or less, or 400 Amps with parallel 200A feeds.
- TED is only suitable for services with maximum 350 MCM conductors. If you have a 3-phase or 230V 50Hz electrical service, TED 5000 will not work.
An installation pictorial can be found here.
Conclusions
Your conclusions.
References
- ↑ Aurora open source forge website
- ↑ Open Source Code Writing Resource
- ↑ Project Page: Raspberry Pi Code Resource
- ↑ Project Page: Open Source Hardware and Software Resource
- ↑ http://openenergymonitor.org/emon/applications/solarpv
- ↑ http://shop.openenergymonitor.com/emontx-arduino-shield-v2-smt/ shop.OpenEnergyMonitor.com
- ↑ http://www.theowl.com/products/intuitionpv.php
- ↑ http://www.ingenero.com.au/sites/default/files/EcoWatt%20Ingenero%20A4%20Flyer-LR_0.pdf
Contact details
- Nicholas Colbrunn nrc190@humboldt.edu.
- Jenna Bader jlb272@humboldt.edu