<left>This paper focuses on the alternative fuel technology available for substitution in lieu of gasoline in the NYC metropolitan area and the implementation of alternative fuel technology.
Introduction
There are several driving factors for alternative and sustainable transportation such as social, economic, and environmental factors. The primary social driving factor is that disadvantaged communities need sustainable transportation for upward mobility. Healthcare, education, and recreational facilities are often located away from the disadvantaged communities (Environmental Protection Agency , August 2011). The most important of these factors is education, which the U.S. Bureau of Labor Statistics have shown directly correlates to salary compensation (U.S. Bureau of Labor Statistics, 2013). In New York City, there are several different modes of transportation. Affordable mass transit such as buses, subways, and railroads enable people to be transported in New York City at a reduced carbon footprint compared to other urbanized regions.
This paper focuses on alternative fuel sources and corresponding carbon dioxide emissions affecting the New York metropolitan area. “Compared to the average American, residents of the MTA region produce 43 percent less CO2 emissions and, thanks to the density of high-value services, enjoy a per capita GDP that is 30 percent higher than the average for U.S. metro areas” (Metropolitan Transportation Authority, February 2009). The EPA recommends future cities to be rezoned for mixed use and to be densely built to enable a transportation system such as in New York City. Also, the MTA is working on a plan to have all buses and subways within 0.4 miles walking distance of all residential neighborhoods to promote the use of mass transit. Since New York City is subjected to the highest congestion and longest commutes, we need to find alternative ways to reduce the carbon dioxide emissions that we do produce.
“On a global scale, the looming threat of climate change has focused attention to the environmental impacts of the transportation sector, which contributes more than 25 percent of our nation’s greenhouse gas (GHG) emissions. CO2 is the primary greenhouse gas emitted by transportation, accounting for 95 percent of transportation’s impact on climate change. In gasoline-powered vehicles, CO2 emissions are nearly directly proportional to the amount of fuel burned” (Environmental Protection Agency , August 2011). The majority of fuel burned in the transportation sector is comprised of natural gas and petroleum.
Background
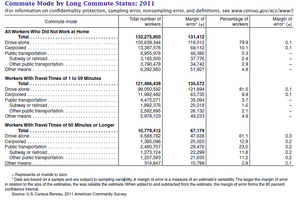
The transportation sector contributes to greenhouse gases, primarily carbon dioxide emissions, through commuting, deliveries, and recreational use. The average national travel time conducted by the U.S. Census Bureau from 2000 to 2010 was 25.5 minutes for commuting. New York City metro area exceeded the average national travel time at 34.9 minutes. 79.9 percent of all commuters drove alone, compared to 81.5 percent who had normal commutes and 61.1 percent who had long commutes as indicated in Figure 1 – U.S. Census Bureau, 2011 American Community Survey, Commute Mode by Long Commute Status: 2011. The U.S. Census Bureau defined “long commute” as a commute that exceeded 60 minutes in one direction. New York State shows the highest rate of “long commutes” at 16.2 percent, followed by Maryland and New Jersey at 14.8 and 14.6 percent, respectively (U.S. Census Bureau, February 2013).
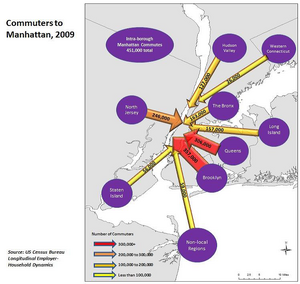
“Even though more than two-thirds of the workforce is composed of New Yorkers, Manhattan has the largest share of “extreme commuters” among its workforce of any county in the nation. The U.S. Census Bureau defines an “extreme commuter” as any individual who travels more than 90 minutes one-way to work on a regular basis, and a 2005 study revealed that residents of counties in the New York metropolitan area were among the likeliest in the entire nation to be “extreme commuters” (NYU Wagner School of Public Service, March 2012).”
Given the attached chart in Figure 2 – U.S. Census Bureau, Commuters to Manhattan in 2009 showing the influx of personnel working in Manhattan, we need to improve transit systems to Manhattan. We need to make transit systems that enter midtown Manhattan in the normal commute time of under thirty (30) minutes from the outer lying areas such as North Jersey and Western Connecticut, where the “long” and “extreme” commuters are primarily located. We need to invest in high speed trains, railroads, and select bus services that are environmentally friendly.
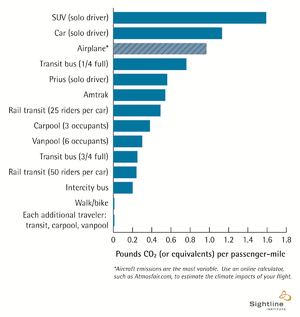
The statistics of the overwhelming majority of the population drives to work alone needs to be considered when implementing carbon dioxide reduction goals. Carbon reduction goals need to be focused on single occupancy vehicles. An SUV vehicle or a compact car releases the most carbon dioxide emissions per person when compared to other alternative transportation such as subway, bus, or railroad. Figure 3 – Carbon Dioxide Produced per Passenger Mile of Transportation Alternatives shows the carbon dioxide emissions produced by different transportation alternatives.
“A regional mode shift from automobiles to transit yields economic and environmental benefits at many levels. For example, the CO2 emissions from transit ridership are about one-fifth of those produced by single occupancy automobiles, as measured on a per-passenger-mile basis. Thus, in addition to overall fuel efficiency, the shift from automobiles to transit means an 80 percent rate of carbon avoidance. Since transportation accounts for nearly 40 percent of GHG emissions in the U.S., the greening of the nation’s largest transit system has significant value, both directly and as an infrastructure model for other urban areas. As it continues to quantify its carbon avoidance rates, the MTA will also be well positioned for emerging carbon trade markets and carbon based funding criteria” (Metropolitan Transportation Authority, February 2009)
Analysis
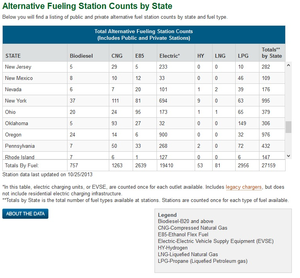
Some alternative fuel technologies currently available are biodiesel, compressed natural gas (CNG), ethanol, electric, hydrogen, liquefied natural gas (LNG), and liquefied petroleum gas (LPG) in lieu of gasoline. New York State already has 37 biodiesel stations, 111 CNG stations, 81 ethanol stations, 694 electric stations, 9 hydrogen stations, 0 LNG stations, and 63 LPG station or more commonly known as propane as shown in Figure 4 - Alternative Fueling Stations Counts of New York and the Total Station Fuel Counts of the United States.
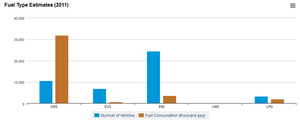
The most popular alternative fuel vehicles in New York State are electric, CNG, or E85 vehicles as shown in Figure 5 – U.S. Energy Information Administration; Alternative Fuel Type Estimates in 2011 Compared to the Number of Vehicles. These sources of fuel are the most popular because they are already in use and have the needed existing infrastructure to support refueling stations. Please note that all gasoline is currently blended with 10% ethanol instead since the existing infrastructure of gas station pumps is compatible with 10% ethanol. The cost and environmental impact to retrofit the stations is not economically feasible due to the limited market to sell the 85% ethanol blend.
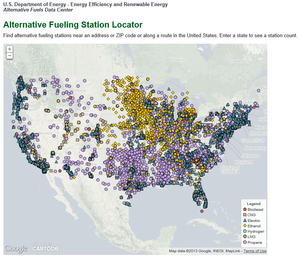
MTA has already put compressed natural gas buses in service but they have their own private refueling stations. The number of alternative recharging stations is growing as shown in Figure 6 – U.S. Department of Energy Alternative Fuel Stations in the United States (2013). There are 27,159 alternative fueling stations in both the public and private sector in the United States as of 2013. The bio-fuel stations are concentrated in the Midwest, where most of the bio-fuel is produced. Electric vehicle refueling stations are located along the East and West Coast, where the population is dense and there is already the necessary infrastructure of electrical substations. LPG refueling stations are located all across the country. We would need to implement widespread CNG, biodiesel, ethanol and LPG refueling stations for the public to be inclined to purchase alternative fuel vehicles. The implementation of CNG and LPG should be very feasible in NYC since there is already existing infrastructure for gas lines.
Discussion
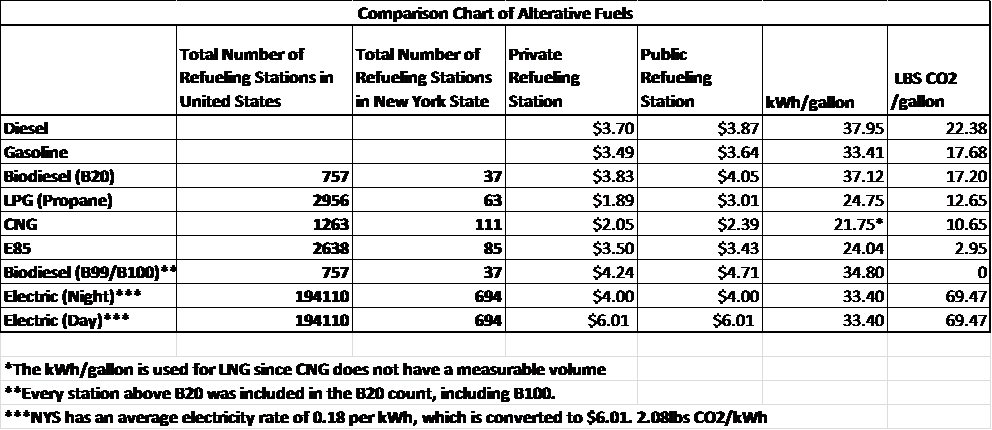
Figure 7 – Comparison Chart of Alternative Fuels in New York State shows that biodiesel B100, ethanol E85, and CNG would result in the most significant reduction in CO2. However, biodiesel is currently more expensive than gasoline, which would be a deterrent for consumers. In contrast, ethanol is cheaper than gasoline, which is a remarkable benefit that would be translated to the consumers (U.S. Department of Energy, 2013). I would not recommend investing in B20 technology since the CO2 produced is comparable to gasoline but rather invest in B100 and E85 technology and refueling stations since these alternative fuels have a significant reduction in CO2.
I would support using the compressed natural gas or “clean air” technology in the interim period it would take to build ethanol and biodiesel refueling stations. “Unlike gasoline, petroleum and coal, natural gas has a negligible sulfur dioxide content, does not contain lead, has a low nitrogen dioxide content, a low particulate content, and a low carbon monoxide content. As well, natural gas does not require carcinogenic (cancer-causing) additives to boost octane levels because natural gas is naturally high in octane. In addition, natural gas is still abundantly available which means that it is practical to rely on its continued supply for hundreds of years into the future. With all these pluses, natural gas is the "natural choice" for New York City!” (NYC Department of Transportation, 2002).
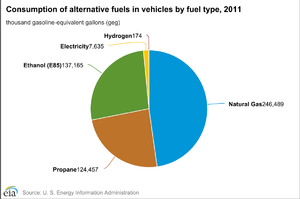
Figure 8 – U.S. Energy Information Administration Consumption of Alternative Fuels in Vehicles by Fuel Type, 2011 shows that the alternate fuel usage for compressed natural gas followed by ethanol and propane is the leading alternative fuels consumed. However, compressed natural gas is also a non-renewable resource; therefore, we need to invest in renewable alternative technology such to be available to mass consumers such as biodiesel and ethanol technology. As shown from the comparison chart, these fuels are the lowest in the carbon dioxide emission and have a comparable energy equivalent to gasoline. However, biofuel B100 is more expensive than gasoline but ethanol E85 is cheaper than gasoline.
One major concern of electric vehicles is that they do not show any fuel consumption in charts but this does not account for the coal that may be consumed to produce the electricity. There are now energy equivalents to compare electric vehicles to other alternative fuels as shown in Figure 7 – Comparison Chart of Alternative Fuels in New York State. Electric vehicles is the second leading alternative fuel technology but are not clean air technology. They produce three times more CO2 than gasoline for the same energy equivalent. Additionally, the price of electricity is a little higher than gasoline. The real problem with electric vehicles is that they are increasing the amount of CO2 produced by threefold.
One impasse from implementing alternative fuels is that there has to be a public shift from purchasing an Internal Combustion Engine which uses petroleum to purchasing a vehicle which uses alternative fuel as the norm. The Internal Combustion Engine (ICE) has dominated the automobile market for more than a century. When framing new transportation policy, it is important to appreciate the scale of the current system—The ICE will continue to be the main technology utilized until electric cars or other replacements are available at scale to the average consumer” (Center for Strategic International Studies, April 2009). The alternative vehicles are often priced higher than a normal vehicle so any savings is not in an upfront cost but years down the line. “But opting for models that promise better mileage through new technologies does not necessarily save money, according to data compiled for The New York Times by TrueCar.com, an automotive research Web site” (Bunkley, 2012). “Analysts say the added cost of the new technologies is limiting the ability of fuel-efficient cars to gain broader appeal. Hybrid sales have surged more than 60 percent this year, but they still account for less than 3 percent of the total market” (Bunkley, 2012).
Conclusion
Government regulation needs to require implementation of energy efficient transportation fuels. They need to pass regulations that limit the amount of carbon emissions that are allowed for the entire nation. The reduction in CO2 will only happen if the entire nation works together toward the goal of reducing CO2. “Over the last several years, states across the nation proposed and in some cases passed measures to regulate and reduce CO2 and other greenhouse gas emissions. The most notable progress made to date is by the Regional Greenhouse Gas Initiative (RGGI), a grouping of 10 northeast states with a functioning regional cap and trade program” (Center for Strategic International Studies, April 2009). “A report issued in November 2012, estimates that RGGI investments will offset the need for more than 27 million megawatt hours of electricity generation and 26.7 million British Thermal Units (BTUs) of energy generation. This savings will help avoid the emission of 12 million short tons of carbon dioxide pollution, an amount equivalent to taking 2 million passenger vehicles off the road for one year” (The Regional Greenouse Gas Initiative, 2012).
Even if the government passes regulations to reduce CO2, they need to promote the purchasing of environmentally friendly vehicles. One of the underlying problems with alternative fuel technology is that is not being implemented nationwide or the entire population has not switched from the internal combustion engine to cleaner fuel technology. The primary reason is that the price is not economically feasible. The government should provide tax credits or subsidize the cost of the environmentally friendly vehicle. Recent studies have shown with gas prices under $4, it would take decades to recuperate the premium cost associated with the fuel efficient vehicle. If CO2 reduction is a goal needed to control climate change, the government needs to regulate the prices of the vehicles for consumers to be more inclined to purchase the environmentally friendly vehicle. Additionally, it would be in the government’s best interest in reducing their dependence on foreign oil.
References
Bunkley, N. (2012, April 5). Payoff for Efficient Cars Takes Years. New York Times, p. B1. Center for Strategic International Studies. (April 2009). Alternative Transportation Fuels and Vehicle Technologies: Challenges and Opportunities. Washington, D.C.: The CSIS Press.
Environmental Protection Agency . (August 2011). Guide to Sustainable Transportation Measures.
Environmental Protection Agency. (2013, September 5). EPA United States Environmental Protection Agency. Retrieved November 16, 2013, from Fuel Economy: http://www.epa.gov/fueleconomy/guzzler/
Metropolitan Transportation Authority. (February 2009). Greening Mass Transit & Metro Regions. Manhattan, NY: MTA.
NYC Department of Transportation. (2002). Alternative Fuels. Manhattan, NY: NYCDOT.
NYU Wagner School of Public Service. (March 2012). Commuting to Manhattan. Manhattan, NY: NYU Wagner School of Public Service.
The Regional Greenouse Gas Initiative. (2012). Regional Investments of RGGI CO2 Allowance Proceeds, 2011. 2012 Regional Greenhouse Gas Initiative, Inc.
U.S. Bureau of Labor Statistics. (2013, May 22). Employment Projections. Retrieved December 8, 2013, from Bureau of Labor Statistics: http://www.bls.gov/emp/ep_chart_001.htm
U.S. Census Bureau. (February 2013). Out-of-State and Long Commutes: 2011. Washington, D.C.: American Community Survey Reports.
U.S. Department of Energy. (2013). Clean Cities Alternative Fuel Price Report. Washington, D.C.: U.S. Department of Energy.
Contact details
Thasha Ramkissoon, E.I.T., thasha.ramkissoon@gmail.com, CUNY City College of New York, G9800 Sustainability in Civil Engineering