No higher resolution available.
Table_A1_-_GT03_Raw_data.png (453 × 327 pixels, file size: 13 KB, MIME type: image/png)
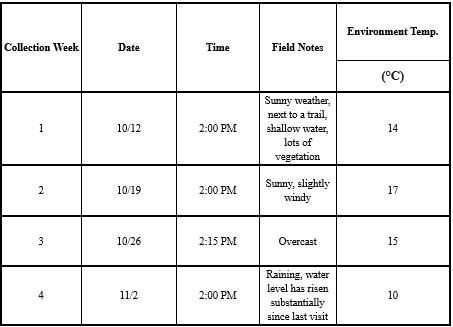
Raw data for Upstream Meadows Park Watershed. Conductivity data for all replicates of weeks 1, 3, and 4 are outliers, as well as for replicate 2 of week 2.
File history
Click on a date/time to view the file as it appeared at that time.
| Date/Time | Thumbnail | Dimensions | User | Comment | |
|---|---|---|---|---|---|
| current | 23:13, 21 March 2023 | | 453 × 327 (13 KB) | Paola Moreno (talk | contribs) | Uploaded a work by Margarita Otero-Diaz, Max Cunningham, Hudson Mierau, Andrew Rodriguez from Assessing the impact of Meadows Park and the surrounding residential area on the water quality and habitat suitability for salmonid species of Janes Creek with UploadWizard |
You cannot overwrite this file.