Size of this preview: 797 × 122 pixels. Other resolution: 1,202 × 184 pixels.
Original file (1,202 × 184 pixels, file size: 50 KB, MIME type: image/png)
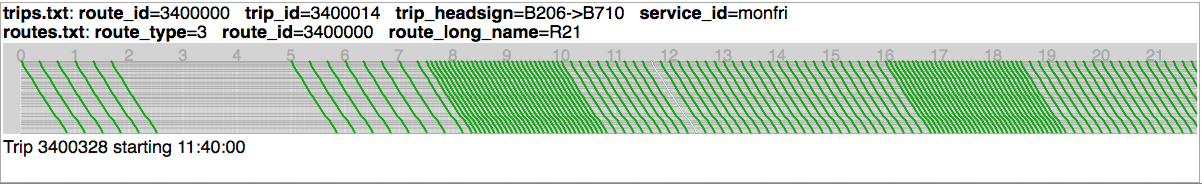
A Time-Distance graph of a bus timetable using constant 30km/h speed throughout the day, with service frequency varying in peak and off-peak conditions.
File history
Click on a date/time to view the file as it appeared at that time.
| Date/Time | Thumbnail | Dimensions | User | Comment | |
|---|---|---|---|---|---|
| current | 08:21, 11 April 2014 | 1,202 × 184 (50 KB) | PatSunter (talk | contribs) | A Time-Distance graph of a bus timetable using constant 30km/h speed throughout the day, with service frequency varying in peak and off-peak conditions. |
You cannot overwrite this file.
File usage
The following 2 pages use this file: