
Size of this preview: 800 × 500 pixels. Other resolution: 1,280 × 800 pixels.
Original file (1,280 × 800 pixels, file size: 13 KB, MIME type: image/png)
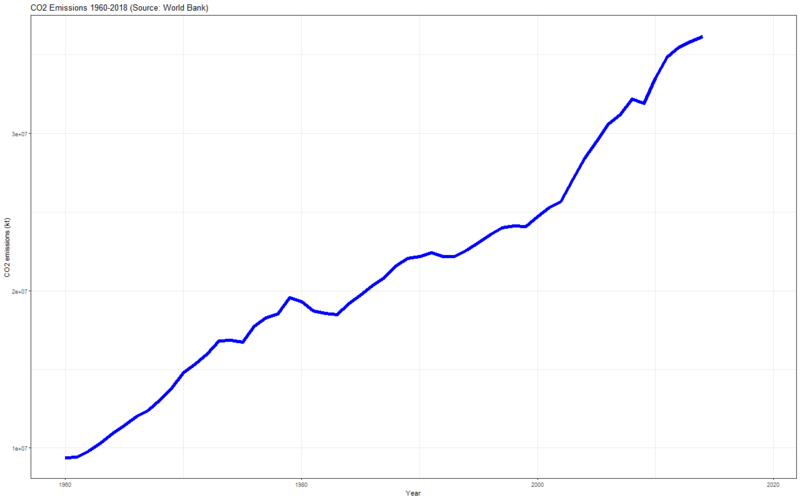
World emissions of carbon dioxide (1960-2018). Chart generated with ggplot2. Source code: https://gist.github.com/dubsnipe/650e143bb4edd782d8faf7f4e4da4d0c
File history
Click on a date/time to view the file as it appeared at that time.
| Date/Time | Thumbnail | Dimensions | User | Comment | |
|---|---|---|---|---|---|
| current | 17:28, 17 January 2020 | | 1,280 × 800 (13 KB) | Emilio (talk | contribs) |
You cannot overwrite this file.
File usage
The following page uses this file: