
No higher resolution available.
BloodSugarHistoryOfUserGeorgedappillyTill13june2011.Ep.op.jp4appro.jpeg (747 × 508 pixels, file size: 164 KB, MIME type: image/jpeg)
This graph is generated using the blood test results of User Georgedappilly. Period 25 Feb 2006 to 13 Jan 2012. Lab results are with the user.
File history
Click on a date/time to view the file as it appeared at that time.
| Date/Time | Thumbnail | Dimensions | User | Comment | |
|---|---|---|---|---|---|
| current | 15:44, 28 January 2012 | | 747 × 508 (164 KB) | Georgedappilly (talk | contribs) | Reverted to version as of 04:57, 20 January 2012 |
| 15:38, 28 January 2012 |  | 747 × 508 (164 KB) | Georgedappilly (talk | contribs) | This picture contains blood sugar results till 13 Jan 2012. | |
| 04:57, 20 January 2012 | 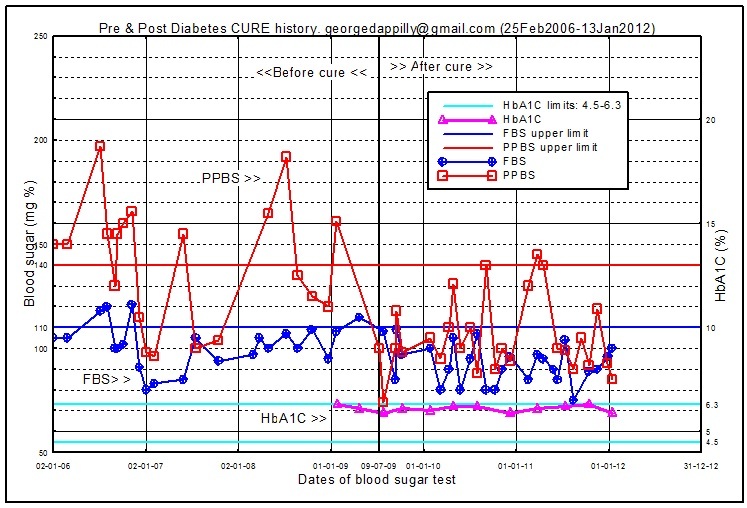 | 747 × 508 (164 KB) | Georgedappilly (talk | contribs) | This picture contains data UP TO 13 JANUARY 2012. | |
| 07:51, 16 October 2011 | 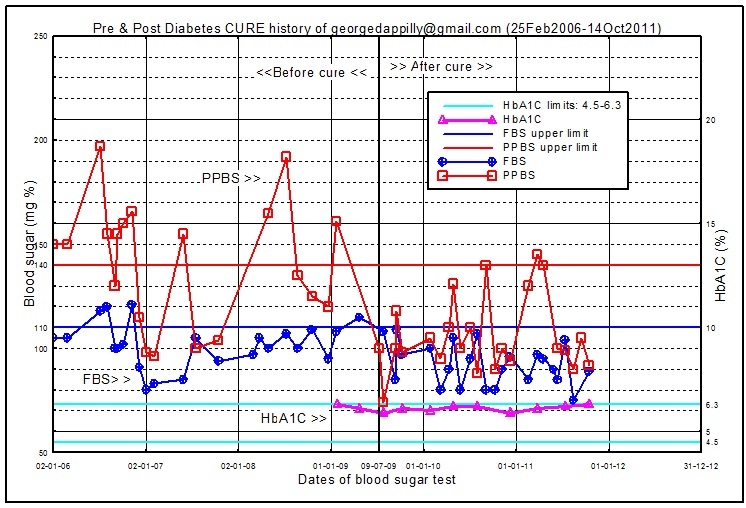 | 746 × 508 (163 KB) | Georgedappilly (talk | contribs) | This contains Test Results of FBS, PPBS & HbA1C till 14 Oct 2011 | |
| 10:40, 25 August 2011 | 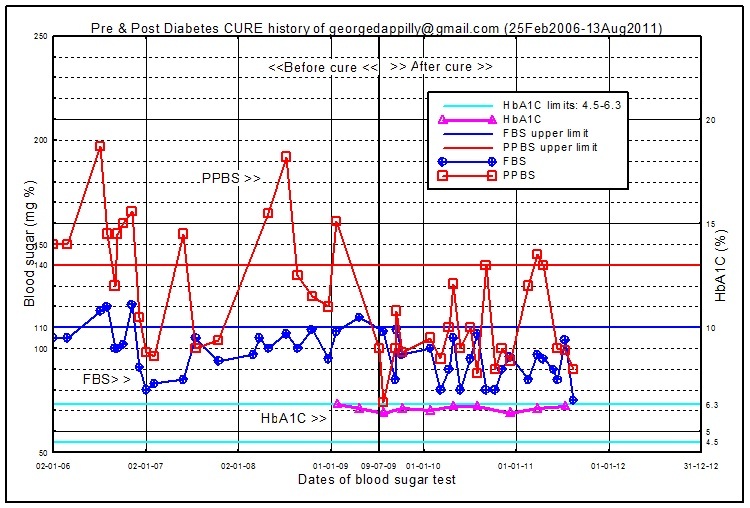 | 750 × 508 (162 KB) | Georgedappilly (talk | contribs) | Data from 14 Jun to 13 Aug 2011 included in the graph | |
| 11:14, 24 June 2011 | 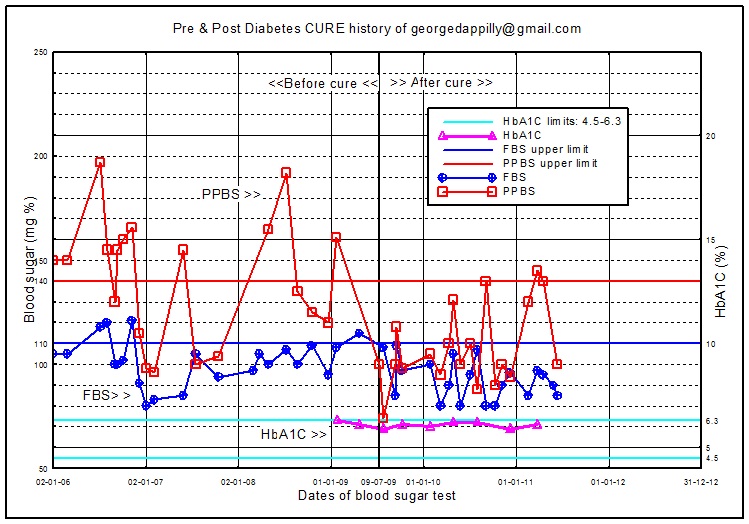 | 749 × 524 (162 KB) | Georgedappilly (talk | contribs) | Incorporated lower & upper limits of HbA1C. They are 4.5(%) & 6.3(%) respectively. | |
| 07:01, 21 June 2011 | 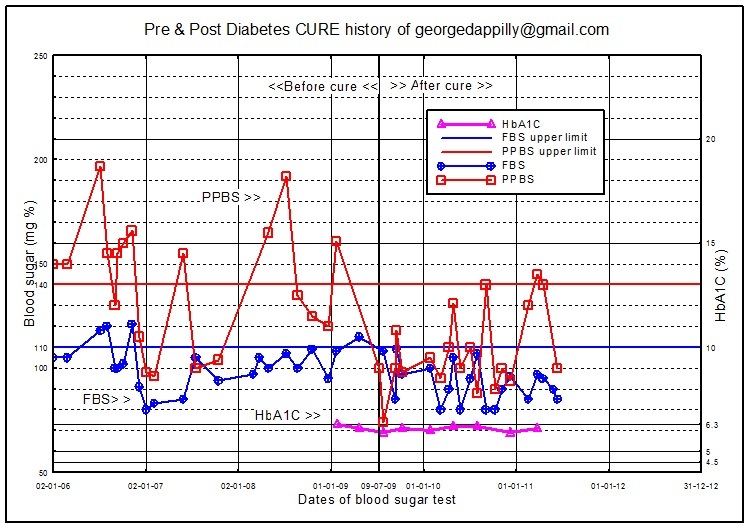 | 745 × 528 (160 KB) | Georgedappilly (talk | contribs) | This graph is generated using the blood test results of User Georgedappilly. Period 25 Feb 2006 to 13 June 2011. Lab results are with the user. |
You cannot overwrite this file.
File usage
The following page uses this file: