
Water Meter
Project Background
WetLand is a mobile self-sustainable island-based ecosystem started in summer of 2014 on a barge located on the Delaware River in Philadelphia, PA. The goal of WetLand is to offer a workspace for artists; a stage for forums on our shared future; and to combine art, life on the water, architecture, and environmental technologies.
OBJECTIVE
The water meter is designed to monitor the volume, flow, and quality of water which is collected and stored on the WetLand habitat. Water on the WetLands habitat is collected through desalination of water from the Delaware river and through rainwater catchment. This water is filtered for use onboard, but requires monitoring to insure its quality for use.
Criteria
| Criteria | Constraint |
|---|---|
| Budget | less than 400.00 |
| Reliability | Must be reliable. |
| Safe | Must pose no threat to the occupants of the WetLands barge. |
| Aesthetics | Must look concise and simple. |
| Durability | Must with stand weather and day to day use by the passengers. |
| Maintainability | Easily maintained and accessed |
| Reproducibility | Has the ability to be reproduced by using the design plans |
| Ease of Use | Able to be used by the everyday citizen |
| Power Consumption | Consumes as little power as possible |
Design
The water meter, designed by Team X, tests the water quality for the WetLands project. The design is composed of five sensors that read the volume, pH, salt water content via conductivity, temperature (Fahrenheit), and the flow of the water into the water tank of the drinking water on the barge. All of the values the sensors take are read by an Arduino programmable microchip and displayed on a liquid crystal display (LCD) screen. While displaying these values it will be saving those values to an SD card that is incorporated into the Arduino microchip.
- componets of the water meter
-
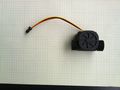
The flow meter
-
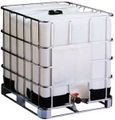
The IBC Tote
-
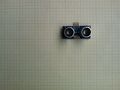
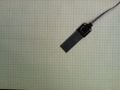
The sonar sensor
-
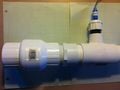
A section of the sampling compartment with the pH sensor integrated
-
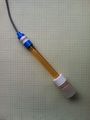
The pH sensor
-
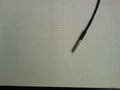
The saline sensor
-
The temperature sensor
-
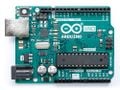
The Arduino
-
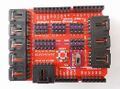
The sensor shield
-
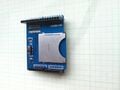
The SD card shield
-
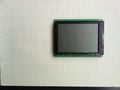
The LCD screen


Flow Meter
The flow meter is to be placed at the inlet of the water take so the amount of water the barge is taking on is known in liters/hour. Another flow meter will be placed near the outlet and used to trigger the monitoring system to test quality of water while being the water is being pumped through the pipes.
IBC Tote
The IBC tote (intermediate bulk container) is where the water for the WetLands Habitat is stored. The tank can hold a total of 275 gallons.
Volume Sensor
The volume sensor is an ultrasonic ping sensor. The sensor emits ultrasonic sound waves that bounces of the water in the tank and reflects back to the sensor. From the time it takes to be emitted and the time it takes to return to the sensor depends on how far away the water is from the sensor. using a conversion factor that varies depending on the distance the volume is calculated and displayed to the LCD screen. All measurements will be displayed in gallons.
pH Sensor
The pH sensor is an Atlas pH sensor that tests for acidity or basicity of the water in the tank. This sensor MUST be constantly stored in water or else it will break and need to be replaced. Also this sensor needs to be calibrated approximately once a week because it is constantly being stored in the testing solution and will need to be cleaned; however, if it is not being constantly used it can be stored and may last up to a year with out being calibrated.
Saline Sensor
The saline sensor is derived from a small volume/conductivity sensor. The probe will read a conductivity value and through a conversion find the parts per million of the salt concentration on the barge.
Temperature
The temperature sensor is used to display the temperature of the water when it is being stored. This will be displayed in Fahrenheit.
Arduino
The entire system runs off of an Arduino Uno programmable microchip. The Arduino is programmed with a specific code located here: http://www.appropedia.org/Team_X_Water_Meter_Arduino_Code. Due to the limited amount of input pins on the Arduino a sensor shield is incorporated to expand the amount of sensors that can be utilized.
LCD Screen
The LCD screen is where all of the data that is read and calculated by the Arduino is displayed. This is designed to be easy to read and comprehend. the reader should right away know if that water they have is potable or if it needs to further be purified.
Data Shield
The Data Storage Shield uses an SD or micro SD memory card to track and store data trends that are being measured by each sensor.
Costs
You may describe your costs here.
| Material | Cost ($) |
|---|---|
| Arduino Uno Microchip | 25.00 |
| LCD Screen | 11.00 |
| Sensor Shield | 10.00 |
| Salinity Sensor | 9.00 |
| Temperature Sensor | 6.50 |
| pH Sensor | 112.00 |
| Flow Rate Sensor(2) | 24.00 |
| Data Storage Shield | 8.50 |
| Sonar Sensor | 5.50 |
| Wiring | 12.00 |
| Plumbing | 47.00 |
| Total | 249.50 |

Instructions
The instructions on how to build the water meter can be found here:
The code for the Arduino can be found here: http://www.appropedia.org/Team_X_Water_Meter_Arduino_Code
File:Arduinocode.doc| Arduino code
Conclusions
The water meter designed by Team X for the WetLand Project has fulfilled the criteria as laid out above
Maintenance
This system is designed to have easy access to the sensors. The pH and saline sensors will need to be cleaned of debris once a week. This is a result of being constantly submerged in the water. The pH sensor must be wet at all times and cannot dry out because the pH sensor will break and need to be replaced. To prevent this, the pH sensor should be stored in a buffer solution if the sensor is not being used. To clean off debris a soft brush such as a toothbrush can be used to brush off the buildup.
References
Contact details
Solomon Clack: skc224@humboldt.edu
Peter Duin: pad177@humboldt.edu
Javier Hinojosa: jh2593@humboldt.edu
Matthew Small: mas1311@humboldt.edu