Model & Method for current sensing MPPT[edit | edit source]
Things needed to understand how this MPPT works.

IV/PV curve and need for mppt[edit | edit source]
First we must understand why would a MPPT be needed, let's take a look at the photovoltaic V-I curve.
-
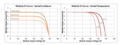
Fig 1: VI curve under different irradiation and temperature
-
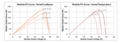
Fig 2: PV curve under different irradiation and temperature
As can be observed from the curve, the output current could be treated as a function of the output voltage of solar cell, which nearly maintains at some constant value until the voltage jumps higher than a specific value, after that the current decrease dramatically and hit the ground. Accordingly the output power, which equals to the product of voltage and current, would have a peak value that is higher than any other output power with different voltage. The result is, to extract the most power out from a solar cell, one has to find this particular operation point for it, otherwise if just leave the solar module to work under uncontrolled states it may not be that efficient or even worthwhile to install one as a power source. What make this difficult is that the curve would shift with a lot of factors: irradiation, temperature, wave length of the light and so on. A mppt method should have the ability to manage a changing circumstance or at least not be misleading.
How MPPT methods work[edit | edit source]

Secondly let's see a typical PV module, its boost converter without DC-AC loop--parts before the AC grid. The graph is on the left. There are plenty of MPPT methods that have already been developed, despite the curve fitting series method--which assuming that we could get access to all the parameters and factors of the model so we can draw the Pv and VI curve just as shown above and use it as a map of operation, all real-time-based MPPT methods are to get the information of the current and voltage of the model by any way that is possible, cause power can only be determined by these two factor-- . Lack of any of them would not leads to a firm state estimate for the PV module, and take the change of other circumstances into account sometimes we might need a way to calculate the slope(dP/dV) of the curve at the operating point to determine the position that the PV is now on the P-V curve. Then the controller will determine to raise or decrease the output voltage so as to reach for the maximum point. For the boost converter here this operation is done by adjust the duty cycle of the switch(IGBT, BJT..) There are many factors that describe a methods' performance: calculation/memory ability needed, stability--dynamic performance, accuracy and tracking speed, complexity/fault rate, cost/efficiency rate and so on.

MPPT method evaluation[edit | edit source]
First a flexible PV module that is easy to control and adjust is needed. For a fully studied model it would not be hard to find.
To evaluate the performance of a MPPT method, one need to run several tests using this method. For now there has not been a officially evaluating standard for MPPT, evaluations concerning MPPT are all comparative studies. To get a total view of the method we will focus on the following test:
1.Maximum Power Point tracking Accuracy under static condition/ Energy extracting efficiency over all time.
2.Tracking speed under static condition. (from a initial set point to the final point, evaluate the time regarding 'distance' of voltage on curve graph)
3.Maximum Power Point tracking accuracy under ripple condition.
4.Tracking speed and accuracy under step changing conditions.
5.Tracking accuracy under changing voltage from the grid side.
By doing this a relative comprehensive performance of the MPPT method might be gained.
To build a PV model with MPPT[edit | edit source]
This chapter is to illustrate how to build a complete DC PV model with MPPT applied. There are several parts of this model: PV array, DC-DC converter, load and DC-AC converter(not included in the model here). The model here is built by using matlab/simulink.
PV array[edit | edit source]
An electrical model for PV array is a must when evaluating its performance under different outer electrical circles, the models that have been most used are double diode model and single diode model. The details of them could been found in here.[1]


Both of them could reflex the output characteristics of PV model, the double diode model is more accurate than the single one but cause more complexity too. Here we would focus on how to build a single diode model. From the figure above we can tell the model has a output current deduction as described:
in which k is the Boltzmann constant, q is the elementary charge on an electron, T is the Device simulation temperature parameter value, V is the voltage across the solar cell electrical ports, A is the quality factor (diode emission coefficient) of the diode.
To make this model work one need to gather several additional parameters of the PV module:
![{\displaystyle I=I_{ph}-I_{s}\left[e^{\frac {q(V+IR_{se})}{AkT}}-1\right]-{\frac {V+IR_{se}}{R_{sh}}}}](https://wikimedia.org/api/rest_v1/media/math/render/svg/74ef691e1e2bf9765cd7faa7080a3939a2405afb)
1.Photo diode current Iph.[edit | edit source]

This value could be gained by a equation describing its relation with irradiation and temperature:
Where Isc, Tref and temperature factor K could be gained through the manufacturer specification.
![{\displaystyle I_{ph}=I_{sc}*{\frac {I_{rr}}{1000}}*\left[1+(T_{cell}-T_{ref})*K\right]}](https://wikimedia.org/api/rest_v1/media/math/render/svg/95b0f4913cb2337c8ff1b4d4134112555752b3e6)
2.Saturation current due to diffusion mechanism Is.[edit | edit source]
The reverse saturation current, IS, is not constant for a given device, but varies with temperature; usually more significantly than VT, (thermal voltage VT, V_\mathrm{T} = \frac{k T}{q}), so that voltage across the diode typically decreases as T increases. The equation giving that is here, here it has been assumed that the saturation Is is s constant.
3.Shunt resistances Rsh and series resistance Rse.[edit | edit source]
These factors represent shunt current leakage to ground and contact resistance of the PV array. For simplicity issue the Rsh is set to infinity and Rse is set to 0.
Use the math and source blocks in the matlab/simulink we can build this model (following are its character curves):


DC-DC converter[edit | edit source]

To build a converter there are several points needed to be confirmed:
Converter type/topology[edit | edit source]
Different type of converter has different application in a circle and with different topology as well, sometimes it would affect the choice of switch and device too. Here what has been applied is a boost converter, which will raise the voltage of its output port as its name implied.

Pulse Width Management method[edit | edit source]
Pulse Width Management Pulse Width Management is a control method to operate high frequency switch as to get a desire value or goal. The frequency of the PWM could affect the performance as well as the cost, choice of the devices. To form a simple PWM signal one could minus a period triangle wave by a constant, and by judging the result's relation with zero a PWm pulse could be gained.
Electrical Switch choice[edit | edit source]
In matlab/sinmulink there are several kinds of power electronic switch that could be used, to form a boost circle one have to pick a type of switch that has gate turn-off function. Here applied in the model is an IGBT switch.
After decision of the type, PWM and switch one could easily build up a DC converter and measure any relating current/voltage using the SimPowerSystem toolbox in matlab/simulink.

To apply a MPPT method[edit | edit source]
There are plenty of MPPT methods that have been developed, the first thing is to understand how a method works, to do that, there are several things to clarify:
1.What kind of electrical topology is this method applied for?
2.What are the input values of this method?
3.How does the method control the corresponding part in circle/ How does the method give out output signal?
The MPPT method basically is a controller that change the voltage of PV and force it moving towards the maximum power point, in some methods it could be treat as a set of logic circle that has a constant relationship between its input and output, the output often drives the converter hence control the voltage, one only need to figure out the relation and translate that into programming language. Here is an example of one kind of mppt logic flow chart on the left.(In which D represent for duty circle, deciding voltage of the converter)
We can see clearly how the program is working and its logic process, this logic loop could also be built by programming using matlab function or the logic blocks in simulink.

In this current detect method the output current of PV array is one of the input of controller, the logic part will use a series of judgement and give out the changing direction of its control signal periodically.
References[edit | edit source]
- ↑ G. Bhuvaneswari and R. Annamalai, “Development of a solar cell model in MATLAB for PV based generation system,” in 2011 Annual IEEE India Conference (INDICON), 2011, pp. 1–5.