
No higher resolution available.
Solar_land_area.png (680 × 480 pixels, file size: 209 KB, MIME type: image/png)
Map of global solar energy resources. The colors show the average available solar energy on the surface (as measured from 1991 to 1993). For comparison, the dark disks represent the land area required to supply the total primary energy demand using PVs with a conversion efficiency of 8%.
File history
Click on a date/time to view the file as it appeared at that time.
| Date/Time | Thumbnail | Dimensions | User | Comment | |
|---|---|---|---|---|---|
| current | 20:57, 10 August 2007 | | 680 × 480 (209 KB) | Canadienito (talk | contribs) | Map of global solar energy resources. The colours show the average available solar energy on the surface (as measured from 1991 to 1993). For comparison, the dark disks represent the land area required to supply the total primary energy demand using PVs w |
| 03:15, 8 August 2007 | 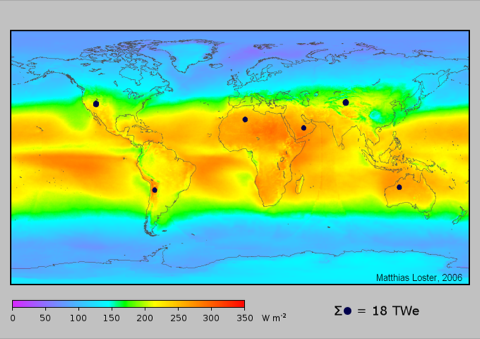 | 480 × 339 (131 KB) | Canadienito (talk | contribs) | Map of global solar energy resources. The colors show the average available solar energy on the surface (as measured from 1991 to 1993). For comparison, the dark disks represent the land area required to supply the total primary energy demand using PVs wi |
You cannot overwrite this file.
File usage
The following page uses this file: