
Size of this preview: 800 × 351 pixels. Other resolution: 1,425 × 625 pixels.
Original file (1,425 × 625 pixels, file size: 41 KB, MIME type: image/png)
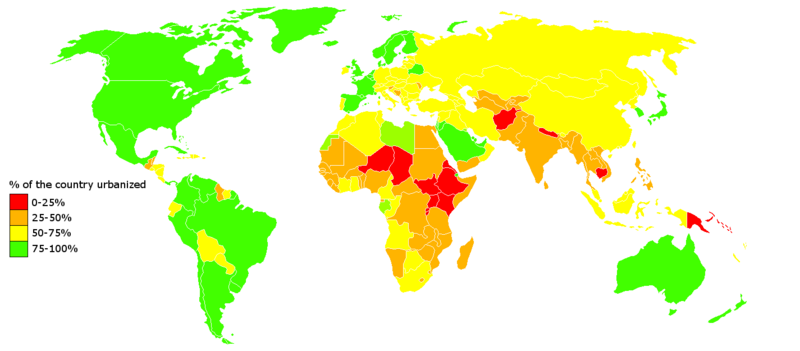
Map showing the degree of urbanization of the different countries. See http://web.archive.org/web/20140928163200/http://esa.un.org:80/unup/Maps/maps_urban_2011.htm Note that the % of urbanization refers to how scattered the houses/roads, ... are within the country. It hence does not refer to the total amount of housing/roads/concrete within the country. The map is thus only an indicator to how well the countries deal with the population number they do have.
File history
Click on a date/time to view the file as it appeared at that time.
| Date/Time | Thumbnail | Dimensions | User | Comment | |
|---|---|---|---|---|---|
| current | 15:32, 15 October 2012 | | 1,425 × 625 (41 KB) | KVDP (talk | contribs) | Map showing the degree of urbanization of the different countries. See http://esa.un.org/unup/Maps/maps_urban_2011.htm Higher degrees of urbanization are beneficial to the environment. The absence of overall high population numbers is beneficial too offco |
You cannot overwrite this file.
File usage
The following file is a duplicate of this file (more details):
- File:Global urbanization.png from Wikimedia Commons
The following page uses this file: