Size of this preview: 800 × 96 pixels. Other resolution: 1,202 × 144 pixels.
Original file (1,202 × 144 pixels, file size: 51 KB, MIME type: image/png)
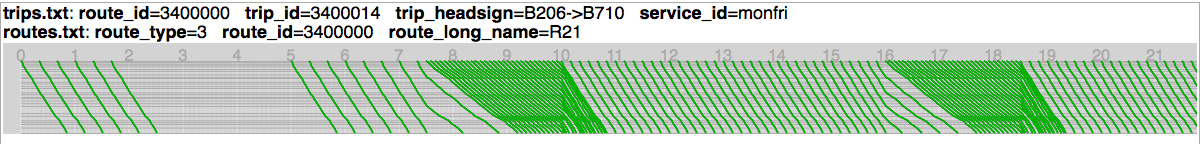
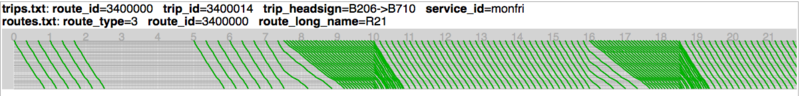
A Time-Distance graph of a bus timetable using a 30km/h 'free' speed and a 15km/hr 'peak' speed representing road network congestion. The service frequency specification is the same as for  , but the speed different causes significant bunching and spreading on the network.
File history
Click on a date/time to view the file as it appeared at that time.
| Date/Time | Thumbnail | Dimensions | User | Comment | |
|---|---|---|---|---|---|
| current | 08:23, 11 April 2014 | 1,202 × 144 (51 KB) | PatSunter (talk | contribs) | A Time-Distance graph of a bus timetable using a 30km/h 'free' speed and a 15km/hr 'peak' speed representing road network congestion. The service frequency specification is the same as for File:Constant-30k-speed-graph.png, but the speed different ... |
You cannot overwrite this file.
File usage
The following page uses this file: